


Australia continues to record a significant number of fatal and serious road crashes each year. While vehicle safety, road design and enforcement have improved substantially over the long term, recent figures show that the national road toll remains stubbornly high.
Australia recorded 1,309 road deaths in 2025. In the first six months of 2026, a further 666 people died on Australian roads, while the rolling 12-month total to June 2026 reached 1,325 deaths.
Those figures only capture fatalities.
Thousands more people are hospitalised following road crashes, while an even larger number of incidents result in minor injuries or vehicle damage. Many of these crashes never appear in national fatality statistics but still require police attendance, insurance claims, vehicle repairs or accident recovery.
That distinction matters when looking at Australian car accident statistics. A road death, fatal crash, serious injury, hospitalisation, injury crash and insurance claim are not interchangeable measures.
This guide examines each separately to provide a clearer picture of road safety in Australia in 2026.
How Australia's Road Toll Has Changed
Australia’s road toll needs to be viewed over a longer period.
The country recorded 1,300 road deaths in 2024, and the National Road Safety Data Hub reports that fatalities had been increasing at approximately 4% per year since the unusually low road toll recorded in 2020.
The latest complete year recorded 1,309 deaths in 2025.
The first six months of 2026 have not provided a clear indication that the problem has disappeared. There were 666 deaths between January and June, bringing the rolling 12-month toll to 1,325.
BITRE’s annual Road Trauma Australia series provides the longer historical record needed to put these recent numbers into context, including road deaths and fatality rates across previous years.
Its monthly bulletins also provide ongoing monitoring of fatal crashes and road deaths as new information becomes available.
The broader picture is more useful than comparing one month with another. Australia’s long-term road safety performance improved considerably over previous decades, but the recent increase from the 2020 low shows that progress is not automatic.
Road Deaths, Serious Injuries and Hospitalisations Are Different Measures
Fatality statistics receive the most attention because they measure the most severe outcome of a road crash. They do not measure the full burden of road trauma.
The National Road Safety Data Hub recorded 35,628 hospitalisations following road crashes in 2022. That included 12,601 drivers and 8,541 motorcyclists, alongside thousands of passengers, pedestrians and cyclists.
The scale of hospitalisation compared with fatalities is significant. For every fatal crash reported in national road toll statistics, there are many more incidents in which someone survives but requires hospital treatment.
AIHW’s transport accident reporting extends the hospitalisation picture through 2024–25 and provides further information about injury patterns and when transport-related injuries occur.
There is another layer below hospitalisation.
A collision can result in an injury that does not require hospital admission. Another crash may cause substantial damage to one or more vehicles without injuring anybody at all. Both can still require roadside assistance, police management, insurance assessment and professional vehicle recovery.
From an accident towing perspective, this is why the road toll should never be used as a proxy for the number of vehicles requiring recovery after crashes.
Australian Road Deaths by State and Territory
Road trauma is not distributed evenly across Australia.
Population size has a major influence on raw totals, which means NSW, Victoria and Queensland will generally record more deaths than smaller jurisdictions.
Fatality rates, road environments and the split between metropolitan and regional travel provide additional context.
The National Road Safety Data Hub provides comparable road-death statistics for NSW, Victoria, Queensland, Western Australia, South Australia, Tasmania, the Northern Territory and the ACT, allowing changes in individual jurisdictions to be assessed against the national trend.
Individual state databases then provide much more detail.
Transport for NSW publishes crash data covering locations, casualties, vehicles and environmental circumstances, with downloadable crash records available for detailed analysis. (Source: https://data.nsw.gov.au/data/dataset/2-nsw-crash-data)
Victoria’s CrashStats system allows crashes to be examined by factors including location, road class and road-user characteristics.
Queensland Transport and Main Roads publishes road safety statistics covering fatalities and broader crash characteristics.
South Australia similarly publishes fatality, serious injury and historical road safety data.
Western Australia’s Road Safety Commission provides statistics that can be separated between metropolitan and regional WA, which is particularly useful given the different road environments across the state.
The Northern Territory also maintains an official road fatality series based on NT Police crash information.
Looking only at which state records the most deaths can be misleading. One of the clearest differences in Australian road safety appears when crashes are examined by remoteness rather than state borders.
Metropolitan, Regional and Remote Australia: Where Is Road Accident Risk Highest?
The risk of dying on Australian roads increases sharply outside major cities.
In 2023, the road fatality rate in Australia’s major cities was 2.0 deaths per 100,000 people. That increased to 12.8 per 100,000 in outer regional Australia, 19.3 in remote Australia and 25.9 in very remote areas.
The gap is substantial. The fatality rate in very remote Australia was almost 13 times the rate recorded in major cities.
There is no single reason for this difference. Regional and remote driving can involve higher travel speeds, longer distances, different road infrastructure and longer distances from emergency medical services.
Crash type matters as well.
More than half of the fatal run-off-road crashes examined by the National Road Safety Data Hub occurred on roads with a posted speed limit of 100 km/h or higher. Approximately 45% of reported run-off-road crashes involved a hospitalised injury.
National crash research also identifies rural location, head-on collisions, heavy-vehicle involvement, run-off-road crashes, alcohol and night or dusk conditions among the factors associated with increased fatality risk.
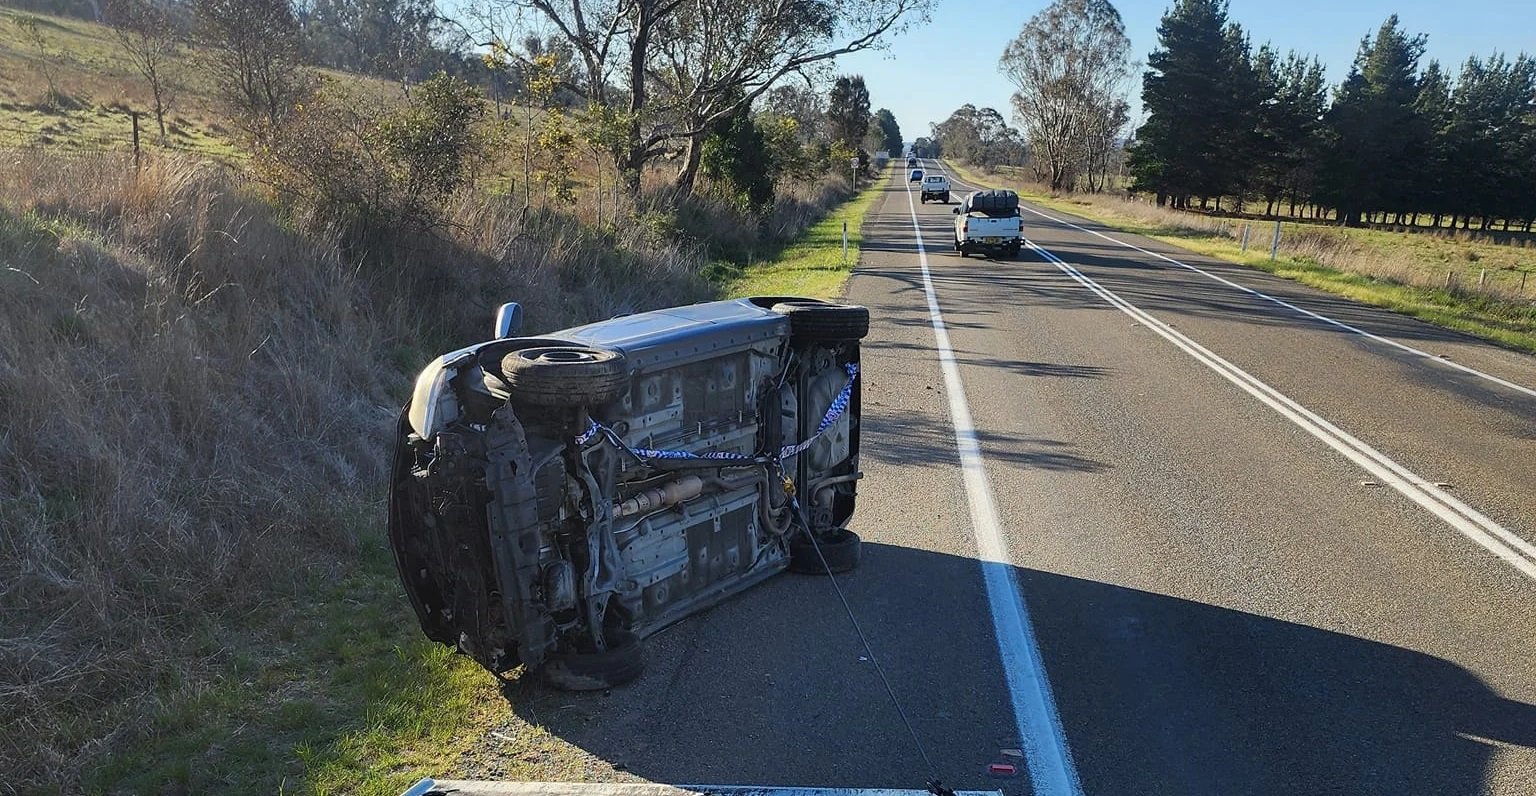
These crashes can also create more complicated recovery situations. A damaged vehicle in an urban intersection presents a different recovery task from a vehicle that has left a high-speed regional road, travelled down an embankment or collided in an isolated area.
Who Is Most at Risk on Australian Roads?
Road trauma affects every type of road user, but the level and nature of the risk varies considerably.
Drivers and Passengers
Drivers make up a substantial proportion of people injured in Australian road crashes.
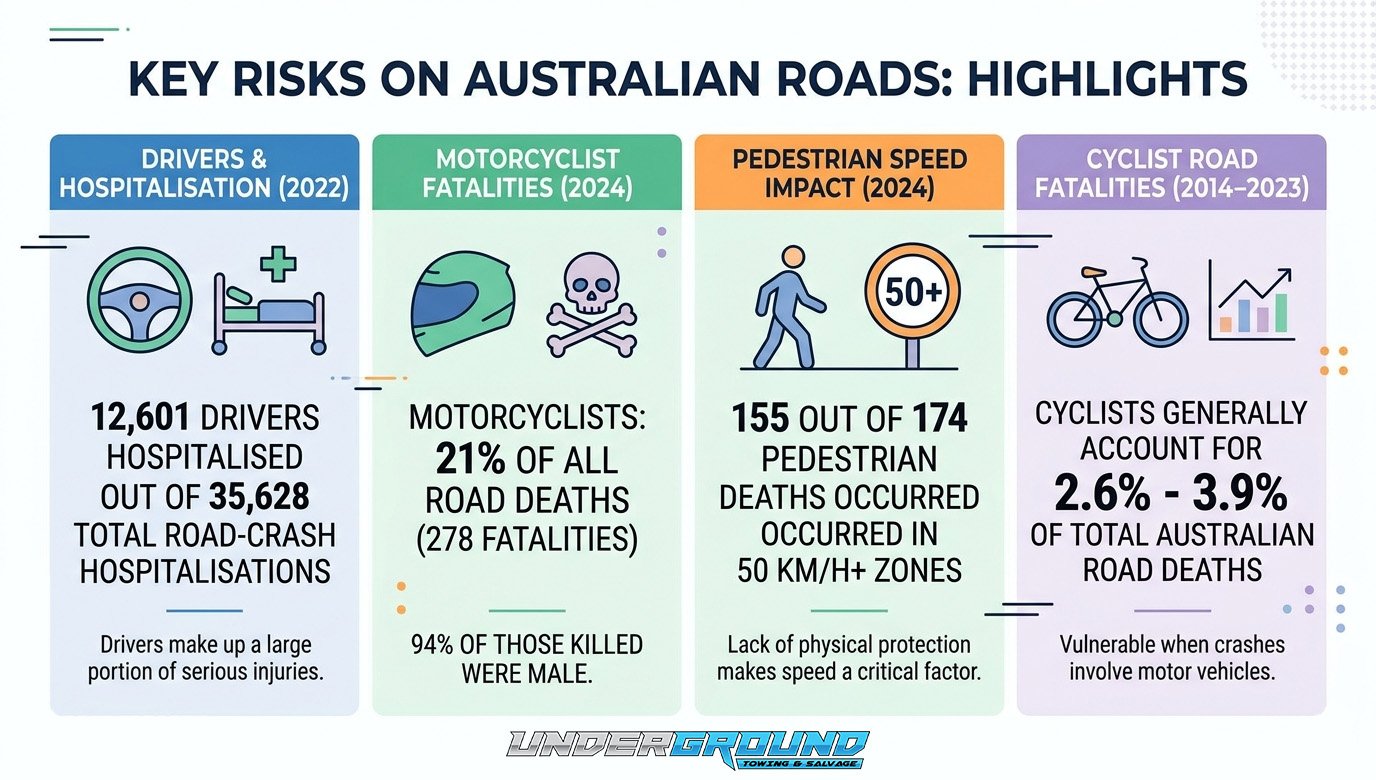
Of the 35,628 road-crash hospitalisations recorded nationally in 2022, 12,601 involved drivers.
Vehicle occupants benefit from decades of improvements in crash structures, airbags, seatbelts and active safety technology. Those systems reduce risk, but they cannot eliminate the forces involved in high-speed, head-on or heavy-vehicle collisions.
Age, gender, speed, environment and crash circumstances also influence the likelihood of serious injury or death. This makes the overall driver total more useful when it is considered alongside demographic and crash-factor data rather than in isolation.
Motorcyclists
Motorcyclists stand out clearly in Australian road trauma statistics.
Australia recorded 278 motorcyclist deaths in 2024, accounting for 21% of all road deaths that year. Of the motorcyclists killed, 94% were male.
Hospital data tells a similar story. There were 8,541 motorcyclist hospitalisations in 2022.
Motorcycles offer far less physical protection than enclosed passenger vehicles, so crashes that might result primarily in vehicle damage for a car occupant can have much more serious consequences for a rider.
Motorcycle accidents also require different recovery methods. A damaged motorcycle needs to be secured and transported correctly rather than handled as though it were simply a smaller car.
Pedestrians
Pedestrians are another vulnerable group because there is effectively no physical protection when they are struck by a vehicle.
Australia recorded 174 pedestrian deaths in 2024. Of those fatalities, 155 occurred in locations with posted speed limits of 50 km/h or higher.
Vehicle speed is particularly important in pedestrian crashes because even relatively small increases in impact speed can substantially change injury severity.
Pedestrian safety is consequently not only an inner-city issue. Arterial roads, suburban centres and higher-speed environments where pedestrians interact with traffic all need to be considered.
Cyclists
Cyclists account for a smaller proportion of Australia’s total road deaths but remain vulnerable when crashes involve motor vehicles.
Between 2014 and 2023, cyclists generally accounted for around 2.6% to 3.9% of Australian road fatalities, with annual cyclist deaths typically ranging between 30 and 44.
As with pedestrians and motorcyclists, fatality totals only capture the most serious outcomes. Injury statistics are needed to understand the wider effect of cycling crashes.
What Contributes to Serious and Fatal Road Accidents?
It is tempting to describe speeding, alcohol, drugs or distraction as the “causes” of Australian car accidents. The underlying data needs more careful interpretation.
Crashes often involve several contributing factors. A driver may be speeding on a poorly lit regional road while fatigued, for example. The statistics are most useful for identifying behaviours and circumstances repeatedly associated with serious outcomes.
Speeding
Speed affects both the likelihood of a crash occurring and the severity of the impact once it happens.
The connection is particularly visible in run-off-road crashes. More than half of fatal crashes in this category examined by the National Road Safety Data Hub occurred where the posted speed limit was at least 100 km/h.
Higher speeds also leave drivers less time to react and increase the energy that vehicles, occupants and roadside objects must absorb during a collision.
Drink and Drug Driving
Alcohol and drugs continue to appear in Australia’s fatal crash data.
Among fatal crashes involving the specified risky driving behaviours in 2023, drug driving was identified in 16.8% and drink driving in 12.0%.
These figures should not be interpreted as saying that 16.8% of every Australian crash involves drugs or that 12% involves alcohol. They refer specifically to fatal crashes within the risky-behaviour dataset.
The distinction matters because overstating causation can make road safety statistics sound more definitive than the underlying evidence allows.
Seatbelt Use
Seatbelts are one of the most established road-safety measures in Australia, yet restraint non-use still appears in fatal crash data.
Non-use of a seatbelt was identified in 14.7% of fatal crashes involving the specified risky driving behaviours in 2023.
Unlike many crash factors, seatbelt use does not necessarily prevent the initial collision. Its importance lies in reducing the likelihood that a crash becomes fatal or results in more severe occupant injuries.
Distraction, Mobile Phones and Unlicensed Driving
Mobile phone use has become a major enforcement focus across Australian jurisdictions.
National police enforcement data tracks mobile-phone offences alongside speeding, drink driving, drug driving, seatbelt offences and unlicensed driving. These figures measure detected offences, so they should not be treated as a complete measure of how often distraction contributes to crashes.
Unlicensed driving was identified in 10.8% of fatal crashes involving the specified risky behaviours in 2023.
Fatigue, Night Driving and Road Conditions
Not every serious crash begins with an obvious traffic offence.
Night and dusk conditions are among the circumstances associated with increased fatality risk in national crash research, alongside rural locations, run-off-road crashes, alcohol, head-on collisions and heavy-vehicle involvement.
Fatigue can be particularly relevant on longer journeys, while weather, visibility and road-surface conditions can change how much time and distance a driver has to respond to a hazard.
These factors often interact. That is why serious road crashes are better understood as the result of combinations of driver behaviour, vehicle characteristics, road conditions and impact circumstances rather than being reduced to one headline “cause”.
What Types of Car Accidents Are Most Common?
Fatal crash statistics are valuable for understanding road trauma, but they are not necessarily the best source for identifying the collisions motorists encounter most often.
Insurance claims provide a different perspective.
NRMA analysed more than 69,000 motor collision claims in 2026, with rear-end crashes and failure-to-give-way collisions among the most common accident types.
AAMI’s Crash Index provides an even larger claims sample. Its research analysed more than 480,000 insurance claims from February 2024 to February 2025, alongside survey responses from more than 2,000 drivers.
This helps explain an apparent mismatch in road accident statistics.
The crashes most likely to kill or seriously injure someone are not necessarily the crashes that occur most frequently.
Rear-end collisions and intersection incidents generate large numbers of insurance claims, while head-on, run-off-road and high-speed single-vehicle crashes may occur less often but have much more severe consequences.
For towing and recovery operators, both ends of that spectrum matter. A relatively low-speed collision can still leave a vehicle unsafe to drive because of damaged steering, suspension, wheels, cooling systems or bodywork.
At the other extreme, a high-energy crash can require specialist recovery before the vehicle can even be loaded for transport.
Vehicle Involvement in Australian Road Accidents
Australia’s road network carries a diverse mix of passenger cars, SUVs, utes, motorcycles, vans, buses and heavy commercial vehicles. Understanding that vehicle mix is important because different vehicles create different risks when crashes occur.
BITRE’s Road Vehicles Australia series provides the current national source for registered vehicle data, allowing road trauma to be considered against the size and composition of Australia’s vehicle fleet.
Historically, vehicle-registration figures were published through the Australian Bureau of Statistics Motor Vehicle Census. That series ended with the 31 January 2021 release and should now be treated as historical rather than current vehicle-fleet data.
Vehicle type becomes particularly important when looking at crash severity. A collision between two passenger cars presents a very different risk profile from one involving a motorcycle, pedestrian or heavy truck.
Heavy-Vehicle Crashes
Heavy vehicles represent a distinct road-safety challenge because their size and mass can increase the severity of a collision.
The National Road Safety Data Hub separately tracks road deaths from crashes involving articulated trucks, heavy rigid trucks and buses through its quarterly heavy-vehicle road-death reporting.
Broader national crash research also identifies heavy-vehicle involvement as one of the factors associated with increased fatality risk in particular crash circumstances.
The recovery requirements can be substantially different as well. Heavy-vehicle crashes may involve larger debris fields, blocked traffic lanes, damaged loads and vehicles that cannot be moved using conventional passenger-vehicle towing equipment.
For motorists, the statistics reinforce the importance of maintaining adequate stopping distances around trucks and recognising that heavy vehicles require more space to brake, turn and manoeuvre.
Canberra Car Accident Statistics
Canberra provides a useful example of why road fatalities should not be used as the only measure of accident activity.
The ACT has a relatively small road toll compared with Australia’s larger states, but its broader crash data shows thousands of incidents occurring each year.
How Many Car Accidents Occur in Canberra and the ACT?
In 2024, the ACT recorded 11 fatal crashes resulting in 11 deaths. During the same year, there were 539 injury crashes and 595 casualties requiring medical treatment.
A further 74 casualties were admitted to hospital.
Those figures represent only part of Canberra’s crash activity.
The ACT also recorded 5,024 property-damage crashes in 2024.
That number provides useful context for motorists because most collisions do not result in a fatality or hospital admission. A vehicle can sustain significant damage without anybody being seriously injured.
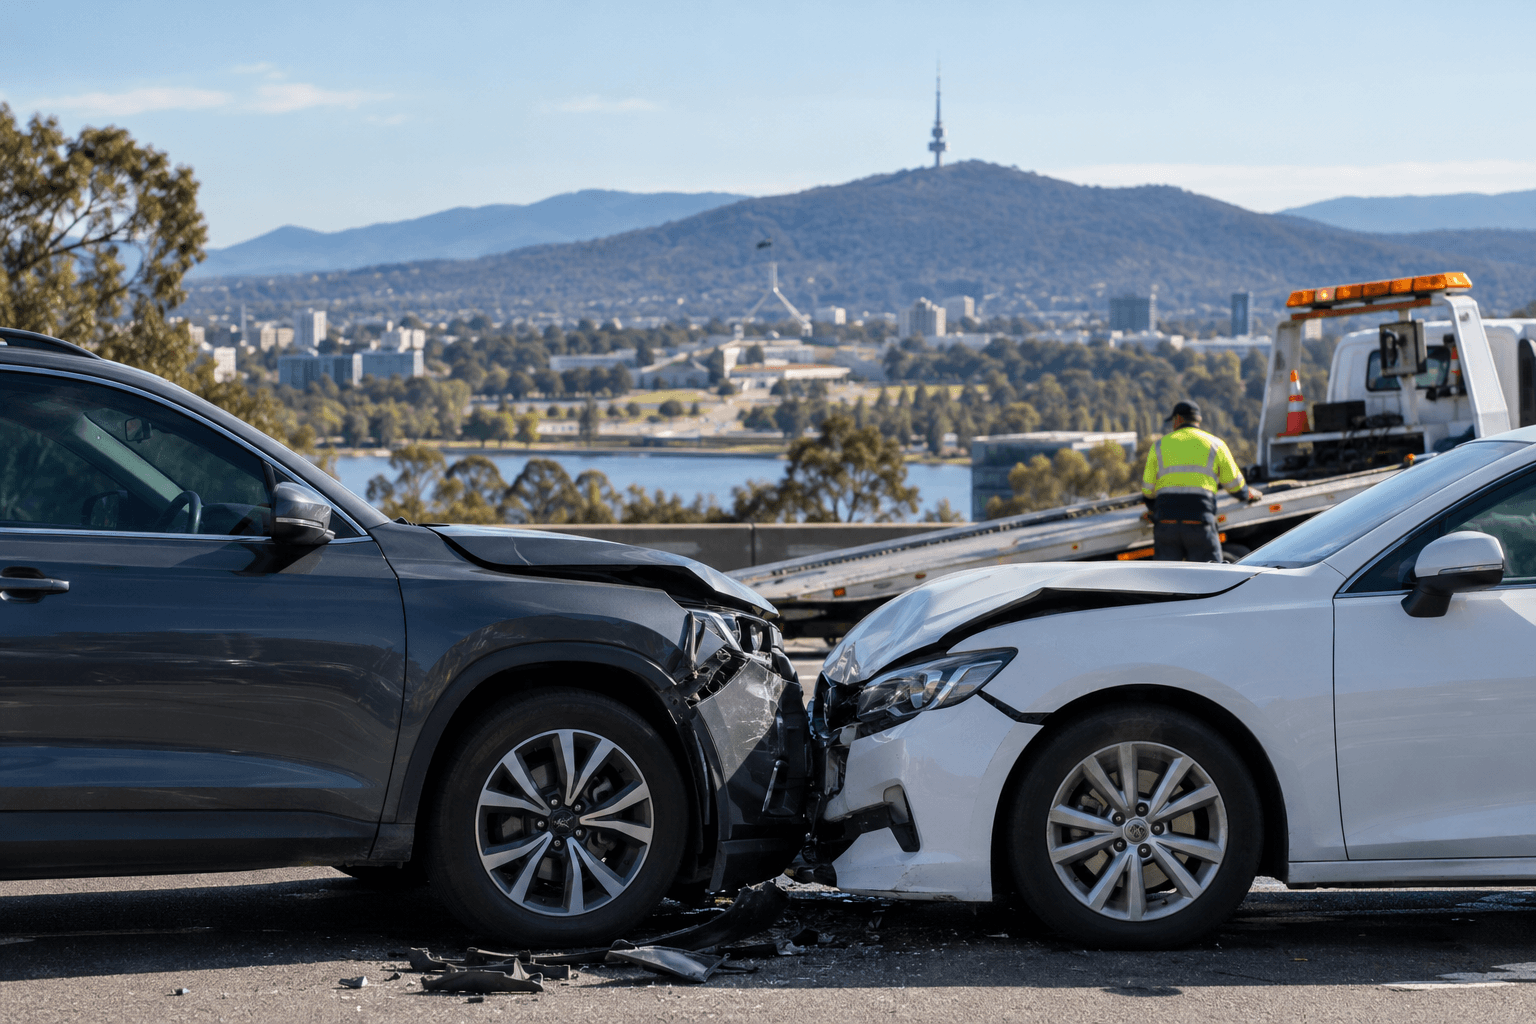
From a towing perspective, property-damage crashes are particularly relevant. Damaged steering, suspension, wheels, tyres or bodywork can make a vehicle unsafe to drive even when everyone involved walks away from the collision.
Who Is Most at Risk on ACT Roads?
Motorcyclists were prominent in Canberra’s 2024 road toll.
Of the 11 people killed on ACT roads, five were motorcyclists, and two were cyclists. Six deaths resulted from single-vehicle crashes.
The figures are notable given the ACT’s relatively small overall road toll. They also mirror the broader national pattern showing that motorcyclists are disproportionately represented in serious road trauma.
Speed was another factor. Three fatal ACT crashes in 2024 involved speeding as a contributing factor.
Canberra's Longer-Term Road Safety Trend
A single year can fluctuate considerably in a jurisdiction as small as the ACT, so the longer trend provides better context.
Between 2020 and 2024, 51 people died on or as a result of crashes on ACT roads.
The ACT Government is using this recent trauma record as part of its Road Safety Framework 2026–2031, which sets the direction for reducing deaths and serious injuries across the territory.
ACT Policing provides another measure of the problem. During the 2024–25 financial year, 345 crashes resulting in injury were recorded, equivalent to 73.0 injury crashes per 100,000 people.
That figure should not be directly compared with the ACT Government’s 539 injury crashes for calendar year 2024. They cover different reporting periods and definitions.
For the latest road toll during 2025 and 2026, ACT Policing maintains an ongoing ACT Road Toll rather than waiting for the next complete annual crash report.
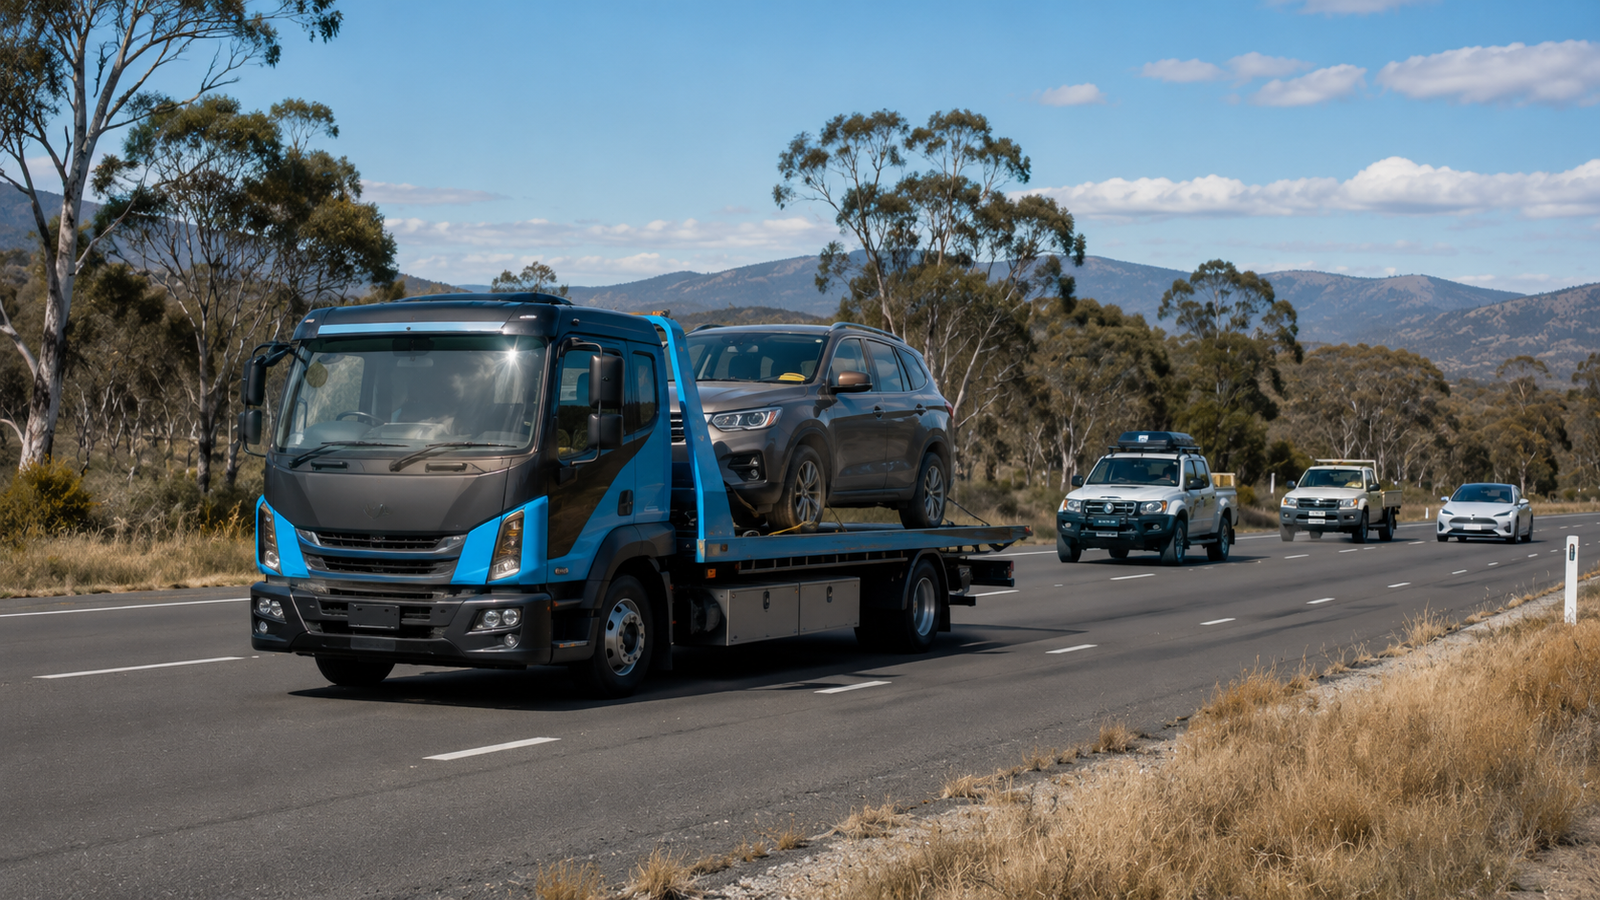
For drivers involved in a collision locally, Underground Towing & Salvage provides a tow truck in Canberra for damaged and immobilised vehicles. The wider ACT statistics show why accident recovery extends well beyond the relatively small number of fatal crashes reported each year.
Tasmania Car Accident Statistics
Tasmania presents a different road-safety environment from Canberra.
A large proportion of travel occurs outside dense metropolitan environments, with regional roads, higher-speed routes and longer distances forming part of everyday driving across the state. The latest complete Tasmanian statistics also show a substantial increase in fatalities.
How Many People Died on Tasmanian Roads in 2025?
Tasmania recorded 43 road deaths in 2025, up from 31 in 2024. That represents an increase of approximately 39% in a single year.
The 2025 toll was also considerably above Tasmania’s 10-year average of 35.1 fatalities per year.
Serious injuries moved in the opposite direction.
There were 282 serious injuries in Tasmania in 2025, down from 308 in 2024. The state’s 10-year annual average was 280.2 serious injuries, putting the 2025 result close to the longer-term level despite the increase in deaths.
This is a good example of why fatalities and serious injuries should be reported separately. One measure can deteriorate while another improves.
Who Was Killed on Tasmanian Roads?
Tasmania’s 43 road deaths in 2025 included:
- 16 drivers
- 9 passengers
- 12 motorcyclists
- 5 pedestrians
- 1 cyclist
Motorcyclists stand out again.
Tasmania recorded 12 motorcyclist deaths in 2025 compared with four in 2024, meaning the number tripled in a single year.
The Tasmanian fatality dataset also provides age and gender breakdowns, allowing the state’s road toll to be examined beyond total deaths alone.
Serious Injuries in Tasmania
The distribution of serious injuries provides another perspective on which road users are affected.
Of the 282 serious injuries recorded during 2025, 105 involved drivers, 55 passengers, 64 motorcyclists, 28 pedestrians and 10 cyclists.
Motorcyclists therefore feature heavily in both Tasmania’s fatality and serious-injury statistics.
The serious-injury dataset also contains demographic information by age and gender, helping identify which groups are represented within the broader road-trauma burden.
Regional Roads and Tasmania's Road Safety Challenge
Tasmania’s geography makes the national urban-versus-regional road safety divide particularly relevant.
Across Australia, the 2023 road fatality rate was 2.0 deaths per 100,000 people in major cities, rising to 12.8 in outer regional areas, 19.3 in remote Australia and 25.9 in very remote areas.
These are national figures rather than Tasmania-specific rates, but they provide important context for states where significant travel occurs on regional roads.
High-speed environments also deserve attention. More than half of the fatal run-off-road crashes examined nationally occurred in speed zones of 100 km/h or above.
For vehicle recovery, location can materially change the job. Recovering a damaged car from a suburban street is different from attending a crash on a regional highway or retrieving a vehicle that has left the roadway.
Underground Towing & Salvage provides car towing in Tasmania for motorists requiring vehicle transport and recovery, including services around Launceston and surrounding areas.
Tasmania’s next road safety strategy shows the scale of the broader challenge. The Tasmanian Government reports 324 people were killed or seriously injured in 2025, compared with the previous strategy’s goal of fewer than 200 deaths and serious injuries annually.
That figure differs slightly from simply adding the separately published 43 fatalities and 282 serious injuries. For accuracy, the government’s killed-or-seriously-injured measure should therefore be treated as its own published indicator rather than recalculated.
Car Accident Insurance Claims and Vehicle Damage in Australia
Police and hospital records measure the human consequences of road crashes. Insurance data captures another side of the problem: damaged vehicles and the financial cost of getting them repaired or replaced.
The Insurance Council of Australia estimates that approximately one in seven motor insurance policyholders, or 14%, makes a claim each year.
That does not mean 14% of Australian motorists crash every year.
Motor insurance claims also cover theft, weather events and other forms of vehicle damage. Claim frequency should therefore remain separate from police-recorded crash statistics.
Collision-specific insurer data is more useful for understanding the accidents that generate everyday vehicle damage.
AAMI’s analysis of more than 480,000 claims from February 2024 to February 2025 provides another large dataset for understanding common Australian crash patterns.
These figures help fill a gap left by fatality statistics. Many collisions that create substantial insurance and repair costs never result in serious injuries.
They can still leave vehicles undriveable.
Modern vehicles can require recovery after apparently moderate impacts because damage to wheels, suspension, steering, cooling systems, sensors or safety systems makes driving them unsafe. Increasing vehicle complexity also means visible body damage does not always reveal the full extent of a post-collision problem.
How Does Australia's Road Safety Record Compare Internationally?
Australia has achieved major improvements in road safety over the long term, but its more recent progress does not look as strong when compared with other developed countries.
Between 2014 and 2023, Australia’s road-death rate declined by 3.6%. Over the same period, the median reduction across OECD countries was 18.6%.
That gap matters.
It suggests that Australia’s recent road safety performance should not be judged only against its own historical results. Other comparable countries have reduced their fatality rates more quickly over the same period.
The comparison also reinforces what Australia’s recent domestic figures already show: reducing the road toll further will require sustained improvements rather than relying on the gains achieved in previous decades.
Australia's Road Safety Priorities and Initiatives
Australia’s road safety response increasingly follows a system-wide approach.
That means responsibility does not sit solely with individual drivers. Safer roads, safer vehicles, appropriate speeds, enforcement and post-crash response all influence whether an error results in a minor incident, serious injury or death.
Police enforcement remains one part of that system. National data tracks offences involving:
- speeding;
- drink driving;
- drug driving;
- mobile-phone use;
- seatbelt and restraint offences; and
- unlicensed driving.
The ACT’s Road Safety Framework 2026–2031 provides a local example of how jurisdictions are using recent trauma data to guide future safety priorities.
The framework follows a period in which 51 people died on or as a result of crashes on ACT roads between 2020 and 2024.
Tasmania is also reviewing its approach through its next road safety strategy following a 2025 result that remained well above the previous target for deaths and serious injuries.
Vehicle technology is another part of the picture. Australia’s registered fleet continues to change as newer vehicles introduce increasingly sophisticated crash avoidance and occupant-protection systems. BITRE’s vehicle statistics provide the national fleet data needed to monitor that transition over time.
Technology can reduce risk, but it does not remove the need for safer behaviour, road design, enforcement or effective post-crash response.
What Australia's Accident Statistics Mean for Motorists, Businesses and Vehicle Recovery Services
The biggest mistake when interpreting Australian car accident statistics is to focus only on fatalities.
Road deaths are the most serious outcome, but they represent one part of a much larger system of road trauma and vehicle damage.
The national road-crash dataset recorded 35,628 hospitalisations in 2022 alone.
Below those hospitalisations are many more collisions resulting in minor injuries or property damage.
The ACT illustrates the difference particularly well. It recorded 11 deaths in 2024, but also 539 injury crashes and 5,024 property-damage crashes.
For motorists, the practical message is straightforward: serious crashes are not confined to one type of road or driver. Speed, alcohol, drugs, restraint use, distraction and road environment all influence risk, while regional and remote roads carry substantially higher fatality rates than major cities.
For businesses operating fleets, a crash can create consequences well beyond the repair bill. Vehicle downtime, employee injuries, insurance claims, disrupted deliveries and replacement transport can all affect operations.
For emergency services and accident recovery operators, the challenge is broader again.
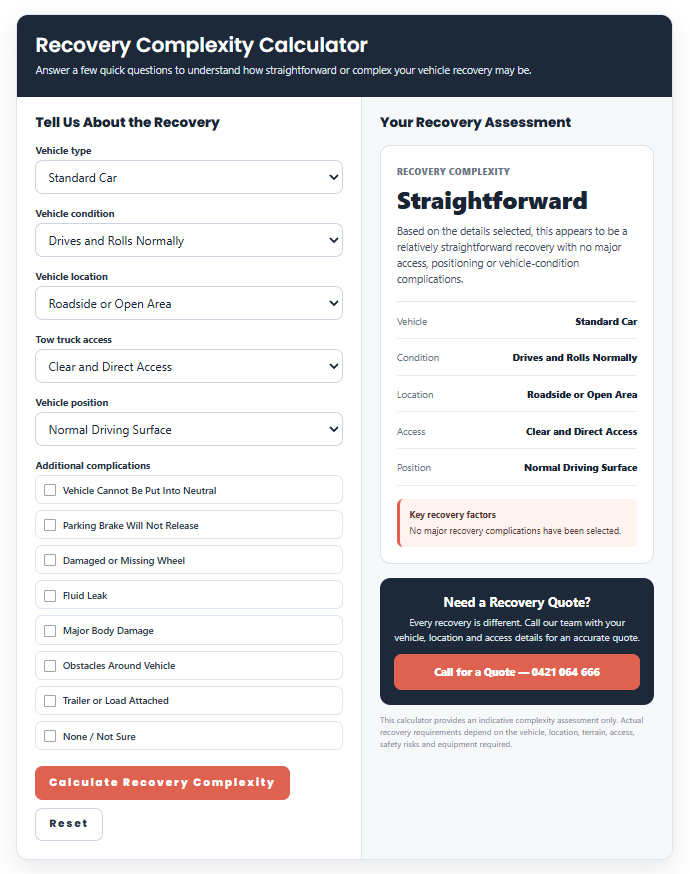
A crash scene may involve a straightforward damaged vehicle on the roadside, or it may require recovery from an embankment, a busy intersection, a high-speed regional road or another difficult location.
Motorcycles, heavy vehicles and severely damaged cars also require different equipment and recovery methods.
“The severity of the crash doesn’t always tell you how difficult the recovery will be. A car can look relatively intact but have damaged steering, suspension or wheels that make it unsafe to move normally. Then you have vehicles that leave the road, motorcycles, tight-access recoveries and badly damaged cars that need a completely different approach. The priority is working out how to recover the vehicle safely without creating another problem.”
Joshua Harrison, founder of Underground Towing & Salvage
Underground Towing & Salvage sees the practical side of this distinction through accident and vehicle recovery work. The condition and location of the vehicle determine what is required at the scene; the severity category recorded later in a road safety database does not.
Professional recovery is ultimately about making the scene safer, removing damaged or immobilised vehicles correctly and transporting them without causing further damage.
Australia Car Accident Statistics: What the Latest Data Tells Us
Australia recorded 1,309 road deaths in 2025, followed by 666 deaths during the first six months of 2026. The rolling 12-month road toll reached 1,325 deaths by June 2026.
The longer-term picture remains concerning. Australia’s finalised 2024 series recorded 1,300 deaths, and national fatalities had been increasing at approximately 4% annually since the low recorded in 2020.
The headline national figures also hide substantial differences in risk.
Motorcyclists accounted for 21% of Australian road deaths in 2024, despite representing only one part of the vehicle fleet.
Regionality matters just as much. The fatality rate in very remote Australia reached 25.9 deaths per 100,000 people in 2023 compared with 2.0 per 100,000 in major cities.
Canberra’s figures show the scale of non-fatal crashes, with 5,024 property-damage crashes recorded alongside 11 deaths in 2024.
Tasmania highlights a different challenge. Its road toll increased from 31 deaths in 2024 to 43 deaths in 2025, while motorcyclist fatalities rose from four to 12.
Taken together, the data shows why there is no single statistic that adequately describes the state of Australian road accidents in 2026.
Road deaths measure one outcome. Serious injuries and hospitalisations measure another. Police crash records reveal incidents that may never appear in either category, while insurance claims capture a much wider pool of damaged vehicles.
Keeping those measures separate gives a more accurate picture of Australian road safety, and a much clearer understanding of the human, financial and vehicle recovery consequences of crashes across the country.