
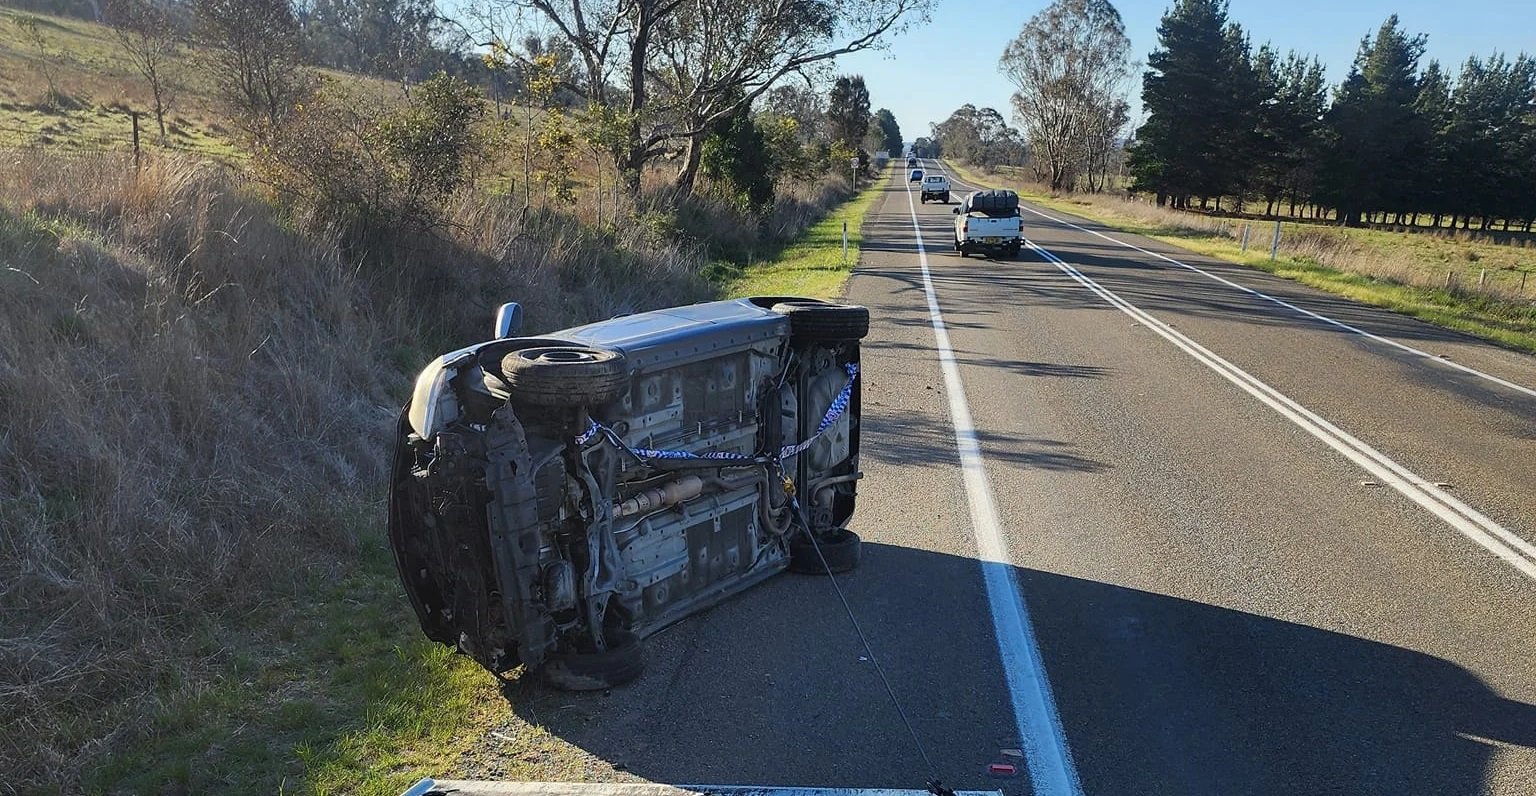
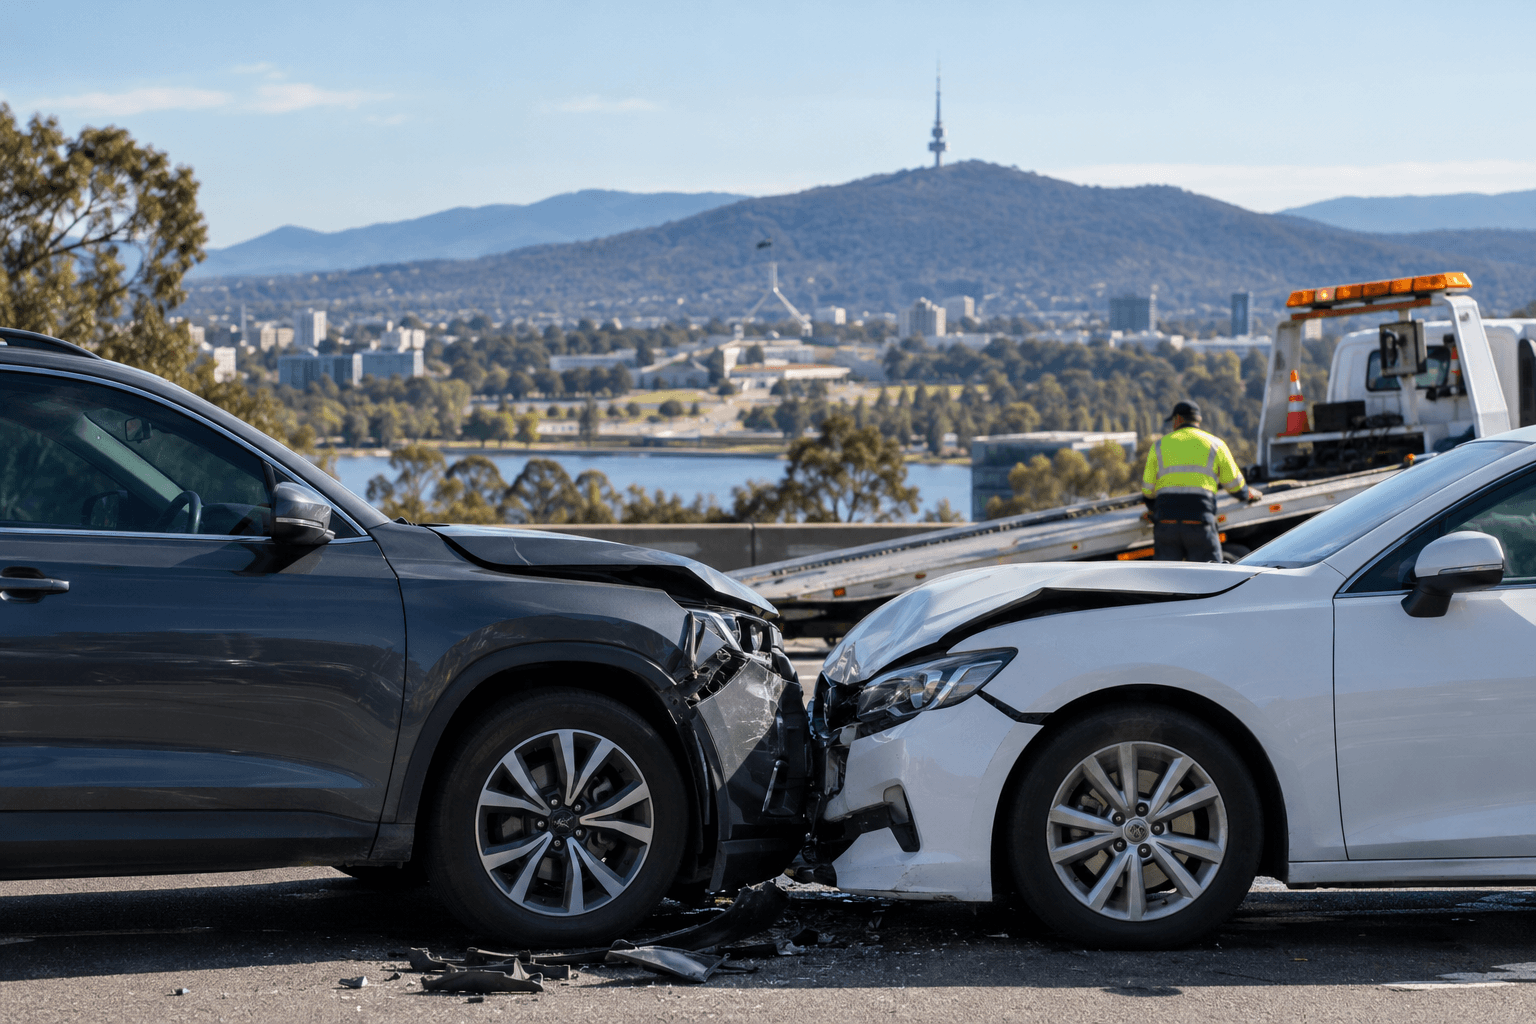
Vehicle accidents in Canberra range from minor car-park collisions to serious multi-vehicle crashes. What happens afterwards can vary just as widely. Some motorists make a vehicle-damage insurance claim, others require treatment through the ACT Motor Accident Injuries Scheme, some vehicles are written off, and only a portion of crashes result in professional towing or recovery.
That makes insurance statistics harder to interpret than they first appear.
In 2024, the ACT recorded 5,024 property-damage crashes, 539 injury crashes and 11 fatal crashes.
That means approximately 90.1% of reported ACT crashes in those categories were classified as property-damage crashes. This does not mean 90.1% became insurance claims. It simply shows that most officially recorded crashes did not result in a fatality or recorded injury.
Insurance data tells a different part of the story. AAMI’s 2026 Crash Index analysed more than 6,400 motor insurance claims from Canberra during 2025, providing one of the strongest recent datasets available on the types of collisions actually reaching an insurer.
That figure should not be treated as the total number of claims made in Canberra. It comes from AAI Limited’s insurance portfolio rather than every Australian insurer.
Taken together, the datasets provide a useful picture of what happens after Canberra vehicle accidents, as long as reported crashes, vehicle-damage claims, personal injury claims, write-offs and towing incidents are kept separate.
How Common Are Insurance Claims After Vehicle Accidents in Canberra?
There is no reliable public statistic showing the exact percentage of Canberra crashes that result in a comprehensive motor insurance claim.
That is an important limitation.
The ACT Government counts reported crashes. Insurers record claims made by their own policyholders. Some minor incidents may result in an insurance claim without appearing in official crash statistics, while other crashes may be reported but never lead to a claim because the driver pays for repairs privately, has no comprehensive cover, or decides the repair cost is too close to their excess.
What we can say is that insurance claims are clearly common.
AAMI analysed 6,400+ Canberra motor insurance claims from 2025 alone.
For broader context, the Insurance Council of Australia estimates that around one in seven Australian motor insurance policyholders makes a claim in an average year. That is a national figure rather than a Canberra-specific claim rate, but it helps show the frequency of motor claims across the insured vehicle population.
The key distinction is simple: a crash is an event; an insurance claim is a financial process that may follow it. They are related, but they are not interchangeable statistics.
What Types of Accidents Generate the Most Claims in Canberra?
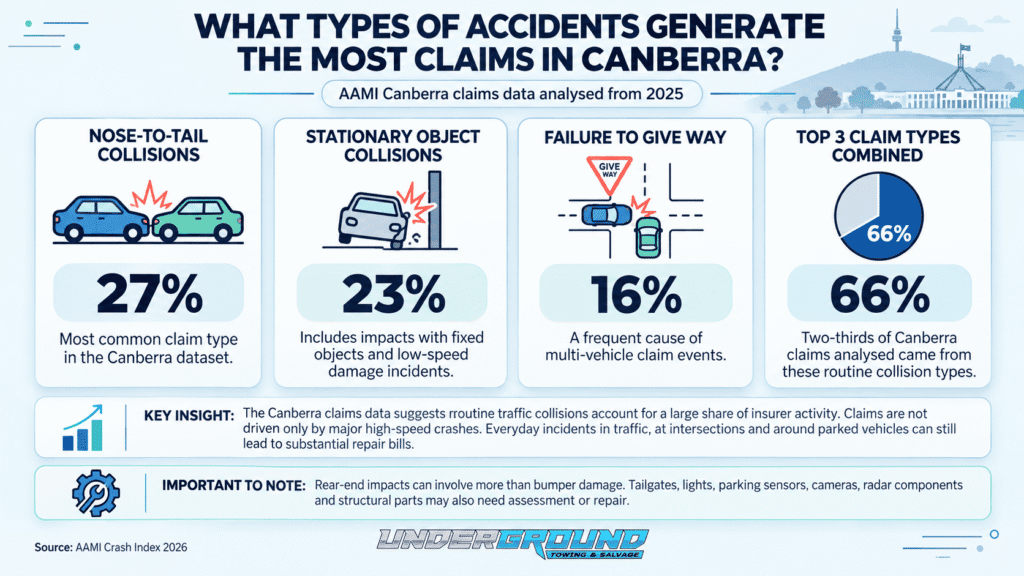
The Canberra claims data suggests that routine traffic collisions account for a large share of insurer activity.
AAMI found that nose-to-tail collisions represented 27% of Canberra claims analysed in 2025, making them the most common claim type in the dataset.
Another 23% involved collisions with stationary objects, while 16% resulted from failure-to-give-way crashes.
Combined, these three categories accounted for 66% of the Canberra claims analysed by AAMI.
Claim type | Share of AAMI Canberra claims |
Nose-to-tail collision | 27% |
Collision with stationary object | 23% |
Failure to give way | 16% |
Combined | 66% |
Source: AAMI
This is important because insurance claims are not dominated only by dramatic high-speed crashes. Everyday collisions at intersections, in traffic and around parked vehicles can still generate substantial repair bills.
A rear-end impact, for example, might damage far more than a bumper. Depending on the vehicle, there may also be tailgate damage, lighting assemblies, parking sensors, cameras, radar components or structural parts requiring assessment.
Car-Park Claims Are Part of the Picture
AAMI’s separate analysis of car-park collisions identified Belconnen, Gungahlin and Tuggeranong as the leading ACT locations for car-park claims.
These incidents are often lower speed than road crashes, but lower speed does not necessarily mean negligible cost. A relatively small impact can damage body panels, wheels, mirrors, sensors or lighting components.
Wildlife Collisions Remain Relevant in the ACT
Wildlife creates a different type of claim exposure for Canberra motorists.
NRMA’s 2025 data identified Canberra, Belconnen and Kambah among the leading ACT locations for animal-collision insurance claims.
Within NRMA’s ACT claims data, William Hovell Drive recorded the highest number of animal-collision claims of any ACT road.
These figures relate specifically to NRMA claims and should not be interpreted as a complete ranking across every insurer or every wildlife collision in the ACT.
What Does a Motor Insurance Claim Typically Cost?
There is no strong public Canberra-specific average claim value, so national figures are more useful here.
Across Australia, the average private motor insurance claim increased from $3,658 in June 2019 to $5,202 in June 2024, a rise of approximately 42.2%.
That does not mean a typical Canberra crash costs exactly $5,202. Claim severity varies widely depending on the vehicles involved, the type of impact, replacement parts, labour, electronics, structural damage and whether the vehicle can be repaired economically.
What the national figure does show is how much more expensive motor claims have become.
Around 60% of Australian motor insurance claim expenditure relates to vehicle repairs, with approximately 30% going to labour and 30% to parts.
Modern vehicle repairs can involve much more than straightening or replacing body panels. Sensors, cameras, driver-assistance systems and electronic components may need replacement or recalibration after a collision.
Repair industry data reinforces the scale of those costs.
AMA Group reported an average repair price of approximately $3,737 across its Capital SMART and AMA Collision businesses in FY26, up 3.3% from FY25.
Its network also averaged around 4,747 repairs per week during FY26, illustrating the scale of collision-repair demand nationally.
Again, these are Australian repair-industry figures, not Canberra claim averages.
Vehicle-Damage Claims and Injury Claims Are Different
One of the easiest mistakes when looking at motor accident statistics is to combine vehicle claims with personal injury claims.
They cover different losses.
A comprehensive motor insurance claim might pay for damage to a vehicle. The ACT Motor Accident Injuries Scheme, by contrast, deals with people injured in motor accidents.
From the scheme’s commencement on 1 February 2020 through to 31 March 2026, there were 2,458 complete applications relating to ACT accidents.
Of the complete applications, 97.1% had been accepted.
That acceptance rate says nothing about whether the applicant’s car was repaired, whether they had comprehensive insurance, or whether the vehicle was written off. It measures eligibility within the personal injury scheme.
A single crash can create both types of claim, but one does not automatically imply the other.
How Serious Do ACT Injury Claims Become?
Most motor accident injury cases do not sit at the same level of severity.
By 31 March 2026, 261 MAI applicants had undergone Whole Person Impairment assessments, with 185 assessed at 5% impairment or higher.
Whole Person Impairment relates to the lasting effect of an injury. It is not a measure of how badly a vehicle was damaged.
There had also been 82 common-law claims lodged for ACT accidents, with 39 finalised by 31 March 2026.
Those figures show the more serious end of post-accident injury claims, where the financial consequences can extend well beyond repairing a car.
How Much Has the ACT Motor Accident Injuries Scheme Paid?
The MAI Scheme reported approximately $132.43 million in total payments to 31 March 2026, although that figure includes interstate accidents where an ACT MAI insurer was responsible.
Using the Commission’s published breakdown, approximately $100.19 million can be attributed to ACT accidents after subtracting $32.24 million in separately identified interstate-accident payments. This is a calculation based on the published table rather than an official MAIC headline figure.
For ACT accidents, the payment mix shows where the financial impact falls:
- 41.3% went towards treatment and care.
- 31.9% went towards income replacement.
- 14.9% related to common-law payments.
- 7.9% covered other costs.
- 2.2% related to funeral and death benefits.
- 1.9% went towards Quality of Life benefits.
This is why the cost of a motor accident cannot be measured only by the damage visible on the vehicle. Serious injuries can create medical costs, lost income and longer-term compensation obligations that sit completely outside the vehicle repair claim.
When Does Accident Damage Become a Write-Off?
A badly damaged vehicle is not automatically a write-off.
Insurers generally assess whether a vehicle can be repaired safely and economically. The decision can depend on its value, the extent of the damage and the likely cost of parts, labour and associated repairs.
Nationally, approximately 25% of Australian motor insurance claims expenditure relates to total losses. This means around a quarter of the money spent on claims, not that one in four accidents or claims results in a written-off vehicle.
The Insurance Council also reports that some insurers have experienced around a 20% increase in total-loss claim frequency since 2019. This is an Australian trend, not an ACT-specific write-off rate.
In the ACT, eligible vehicles assessed as total losses are recorded through the Written-Off Vehicle Register, with different requirements applying to statutory and repairable write-offs.
There is no reliable recent public figure showing what percentage of Canberra accident-damaged vehicles are written off, so it would be misleading to estimate one.
Where Are Insurance Claims Concentrated in Canberra?
AAMI’s 2025 claims data provides a useful local picture of where its Canberra claims were concentrated.
Hindmarsh Drive in Phillip ranked first, with the Hindmarsh Drive and Melrose Drive intersection identified within the hotspot.
The remainder of AAMI’s top five was:
- Hindmarsh Drive, Phillip
- Tuggeranong Parkway, Curtin
- Canberra Avenue, Fyshwick
- Benjamin Way, Belconnen
- Drakeford Drive, Kambah
Four of the five locations had nose-to-tail crashes as their most common claim type, while stationary-object collisions were the leading type at Benjamin Way.
These should be described as leading locations within AAMI’s claims data, rather than automatically being labelled Canberra’s most dangerous roads. A different insurer or the ACT Government crash database may produce a different ranking because each dataset measures different incidents.
Car parks show another geographic pattern. AAMI identified Belconnen, Gungahlin and Tuggeranong as the leading ACT suburbs for car-park collision claims.
Wildlife claims have their own pattern again, with NRMA identifying William Hovell Drive as the leading ACT road for animal-collision claims in its 2025 dataset.
When Are Canberra Claims Most Common?
Claim timing varies depending on the type of accident.
Across AAMI’s main Canberra claims dataset, Wednesday recorded the highest claim volume, while 1:00pm to 4:30pm was the peak time period.
Car-park claims followed a slightly different pattern. In the ACT, Friday was the busiest day for AAMI car-park claims, with 12:00pm to 4:00pm the peak period.
Those findings are not contradictory. They measure different types of claims.
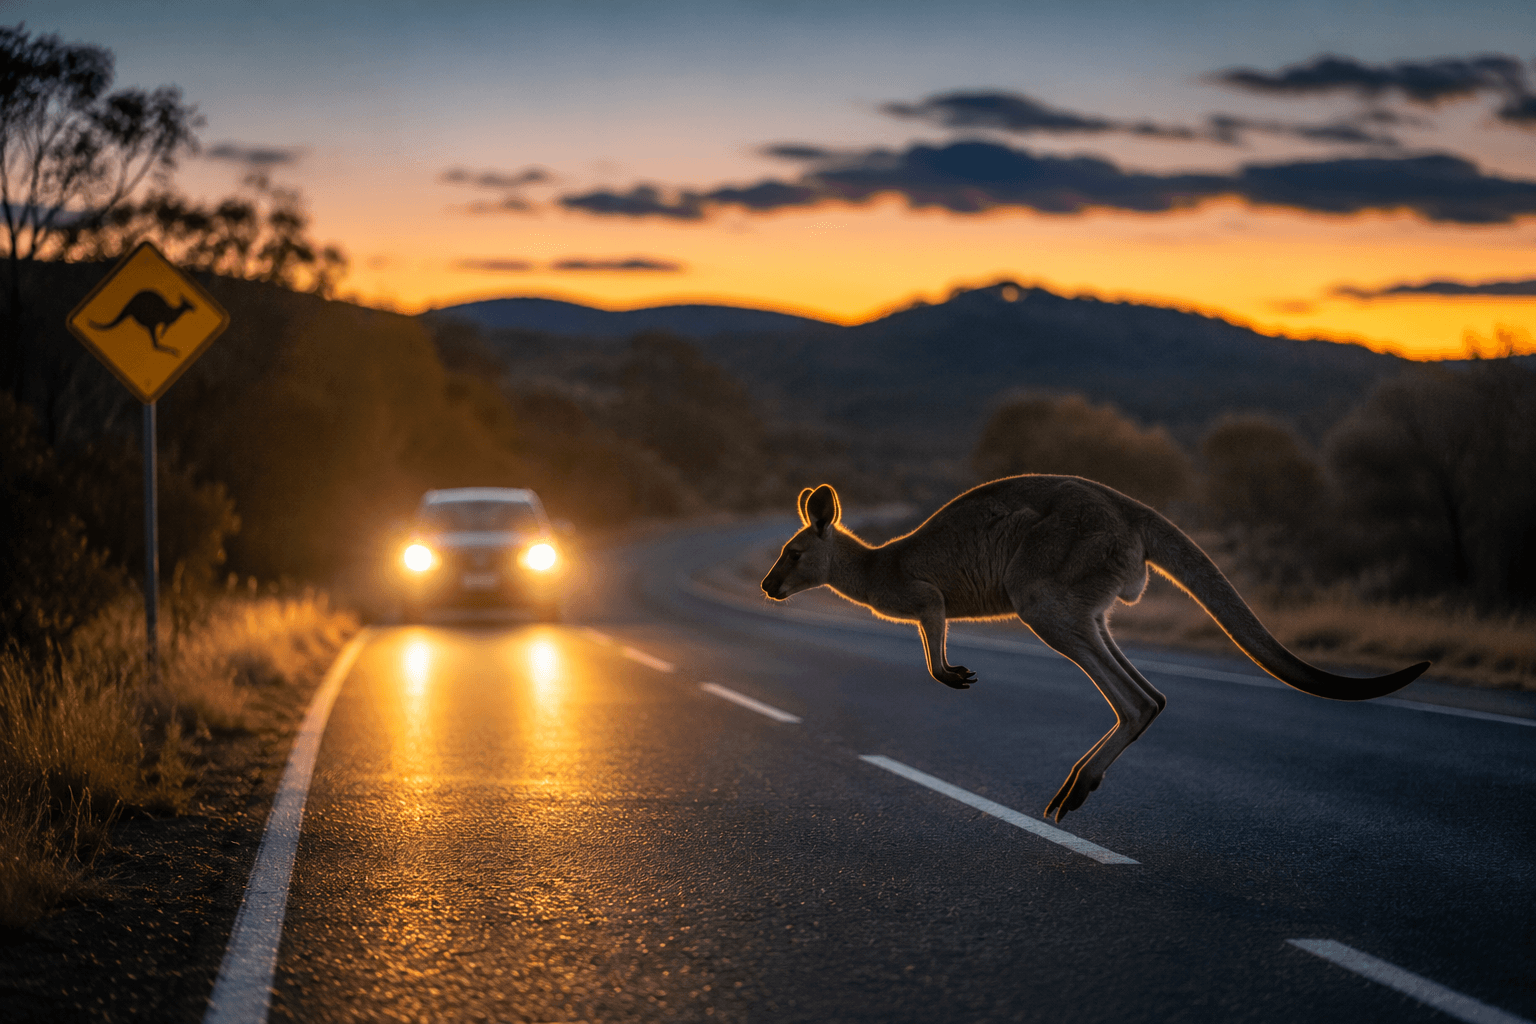
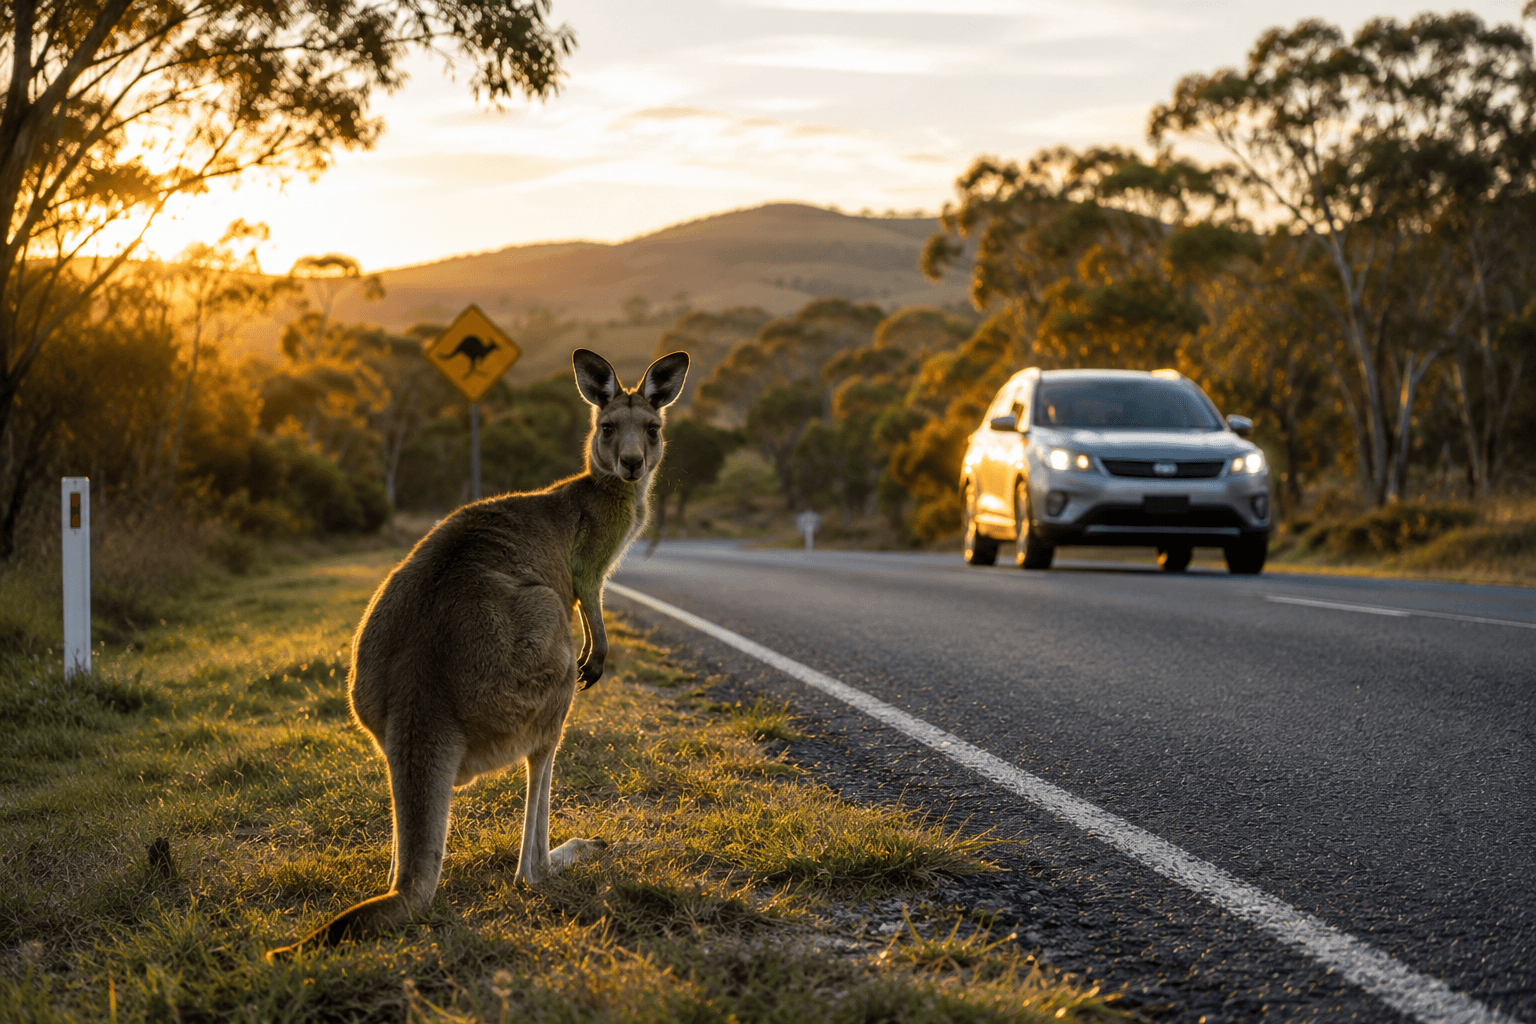
Wildlife collisions also follow a different rhythm. NRMA received more than 15,000 animal-collision claims nationally during 2025, 21% more than in 2024, with kangaroos accounting for approximately 84% of wildlife-related car insurance claims.
NRMA’s national data found wildlife claims increasing through the cooler and darker part of the year, with July recording the highest volume nationally. That is useful seasonal context for ACT motorists, but it should not be interpreted as proof that July is Canberra’s highest wildlife-claim month specifically.
Why Are Motor Insurance Claims Getting More Expensive?
The rise in average claim value is closely tied to what it now takes to return a damaged vehicle to the road.
Parts and labour account for around 60% of Australian motor claims expenditure, making repair costs one of the biggest drivers of overall claim severity.
Time is becoming a cost issue as well.
Average vehicle repair time increased from 38.57 days in 2019 to 61.25 days in 2024, an increase of about 58%. The Insurance Council links the change to factors including labour shortages and delays obtaining parts.
Longer repairs matter because the cost of a claim can extend beyond the workshop invoice. Depending on the policy, insurers may also face replacement-vehicle expenses and other associated costs while repairs are completed.
The AMA Group’s FY26 figures provide a more recent repair-industry signal, with the average repair price across Capital SMART and AMA Collision increasing 3.3% to $3,737.
As the cost of repairing a vehicle rises, the economics of a claim change. Damage that might once have been economical to repair may move closer to the point where an insurer assesses the vehicle as a total loss.
When Does a Canberra Accident Require Towing?
An insurance claim does not automatically mean the vehicle needs to be towed.
A minor collision may leave a vehicle legally and mechanically safe to drive. Other vehicles can appear reasonably intact but have damage that makes continuing unsafe.
From an accident-recovery perspective, some of the problems that matter most are not always obvious from the outside. Steering or suspension components may be bent, a wheel or tyre may be compromised, fluid may be leaking from the cooling system, or bodywork may be interfering with a wheel.
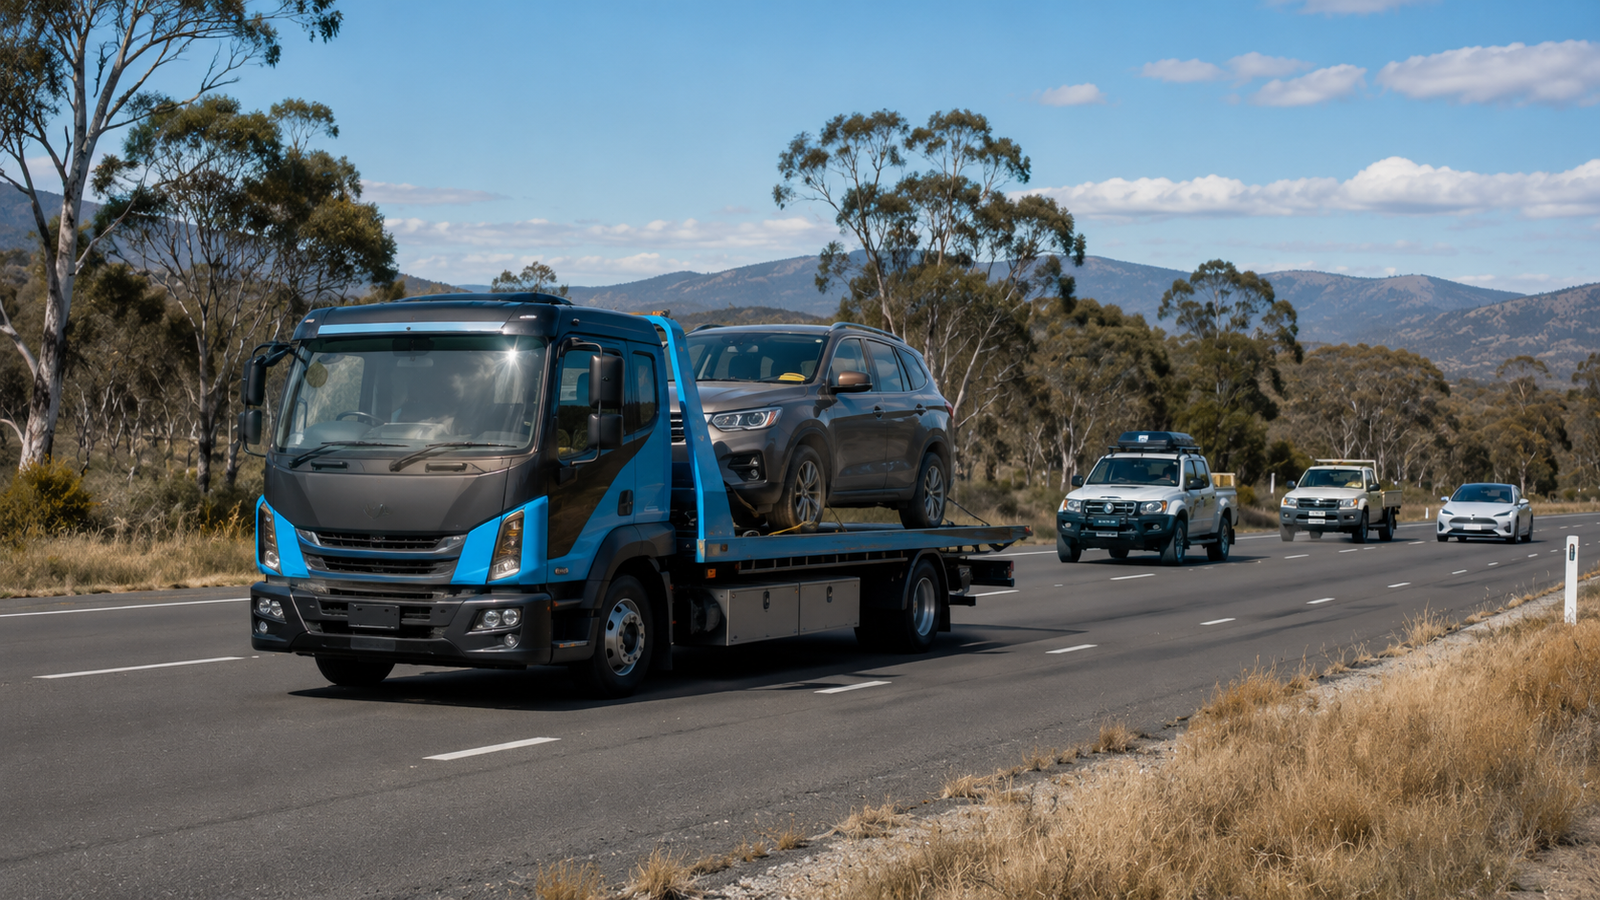
If there is doubt about whether the vehicle can be driven safely, professional assessment and recovery are usually more sensible than attempting to continue the journey. Underground Towing & Salvage provides towing in Canberra for vehicles that cannot safely leave the accident scene under their own power.
Towing also forms part of the wider financial cost of motor claims. Across Australia, towing represents approximately 2.5% of motor insurance claims expenditure. That confirms it is a recognised post-accident claim cost, but it does not tell us how many Canberra accidents require a tow.
Whether the insurer ultimately covers the towing charge depends on the policy, the circumstances of the accident and the insurer’s claims process.
For motorists who need to arrange recovery directly, our guide to how much a tow truck costs in Canberra explains the practical factors that can affect the price.
What Do the Statistics Mean for Canberra Motorists?
The clearest conclusion is that insurance claims after Canberra vehicle accidents are common, but there is no defensible single percentage showing how many crashes become claims.
The available evidence instead gives us several different views of the same problem.
Official ACT statistics recorded 5,574 fatal, injury and property-damage crashes in 2024, with property-damage incidents accounting for the vast majority.
AAMI separately analysed more than 6,400 Canberra motor insurance claims from 2025, showing that nose-to-tail crashes, stationary-object collisions and failure-to-give-way incidents make up a large share of the claims seen by that insurer.
The financial consequences vary just as widely.