


Road fatalities in Tasmania increased by 38.7% in 2025, while serious injuries fell by 8.4%.
It was a striking difference: more people lost their lives on the state’s roads, even as fewer people were recorded as seriously injured.
Underground Towing & Salvage analysed five years of official Tasmanian Government road trauma statistics, covering 2021 to 2025, to examine how fatalities and serious injuries have changed.
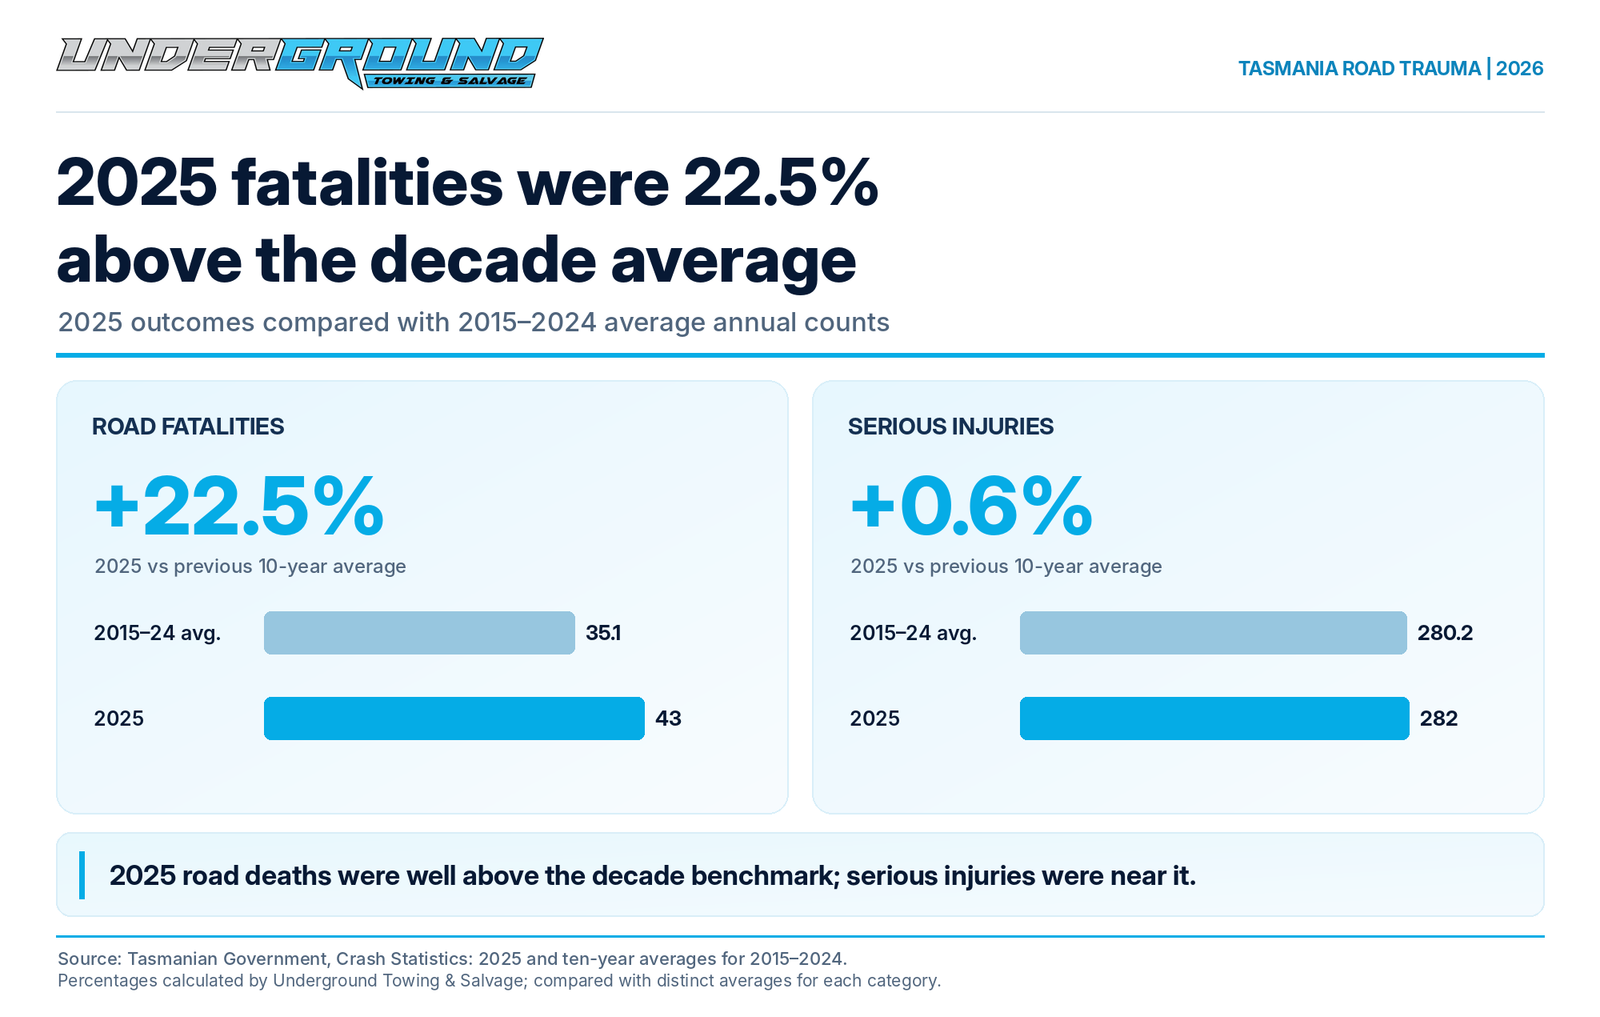
Our calculations reveal another important contrast. Tasmania’s 2025 road fatalities were 22.5% above the preceding ten-year annual average, while serious injuries were just 0.6% above their corresponding historical benchmark.
These findings show why road safety performance cannot be understood from the annual road toll alone.
Key Findings From Underground Towing's Tasmania Road Trauma Analysis
- Australia has approximately 8,579 registered vehicles for every employed tow truck driver.
- An estimated 640 tow truck drivers are aged 55 or older, compared with approximately 666 under 35, a difference of only 26 drivers.
- Tow Truck Driver was not classified as being in shortage nationally or in any jurisdiction in 2025, although Victoria recorded a shortage in 2024.
- Australia does not publish an authoritative tow-truck-specific vacancy count or turnover rate.
- In a no-replacement sensitivity scenario involving the current 55+ cohort, registered vehicles per remaining driver would increase by approximately 32.6%.
- 49.3% of Australia’s registered vehicles were manufactured in 2014 or earlier.
- Australia’s older-vehicle population was approximately 9.1 times the size of total 2025 new-vehicle sales.
- RACV figures indicate approximately 173,000 Victorian callouts were not fixed on-site, while RACQ figures indicate approximately 66,323 Queensland motorists were not returned to the road by attending patrols.
- SUVs and light-commercial vehicles accounted for 83.3% of new vehicle sales, indicating a continuing shift towards larger vehicles with different recovery requirements.
- Tasmania stands out with the highest older-vehicle share, highest older-vehicle-to-driver ratio and lowest relative new-sales rate.
Tasmania Recorded 194 Road Fatalities and 1,417 Serious Injuries Between 2021 and 2025
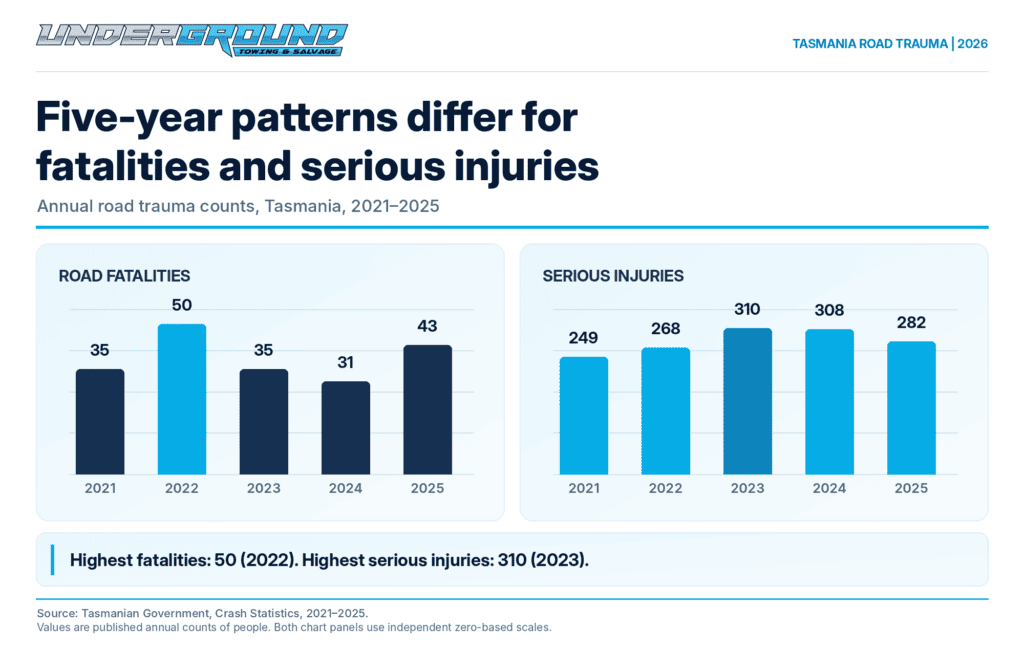
Tasmania’s road trauma figures have fluctuated considerably over the past five years.
According to the Tasmanian Government’s annual crash statistics, fatalities ranged from 31 to 50 per year, while serious injuries ranged from 249 to 310.
Year | Road fatalities | Serious injuries |
2021 | 35 | 249 |
2022 | 50 | 268 |
2023 | 35 | 310 |
2024 | 31 | 308 |
2025 | 43 | 282 |
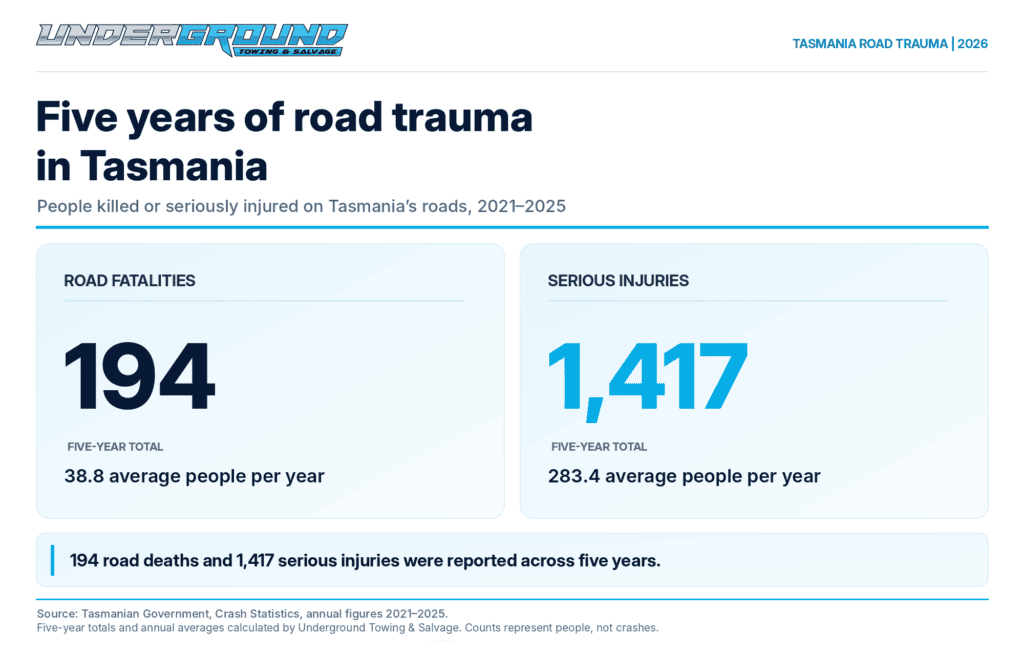
Five-year total | 194 | 1,417 |
Annual average | 38.8 | 283.4 |
Source: Tasmanian Government, annual crash statistics 2021–2025. Totals and averages calculated by Underground Towing & Salvage.
The highest annual fatality count occurred in 2022, when 50 people died. Fatalities subsequently fell to 35 in 2023 and 31 in 2024 before increasing to 43 in 2025.
Serious injuries followed a different pattern. They increased from 249 in 2021 to a five-year high of 310 in 2023, remained close to that level in 2024, and declined to 282 in 2025.
The two measures therefore did not consistently move together.
This distinction matters because fatalities measure deaths, while serious injuries capture a separate category of harm. A reduction in one does not necessarily indicate a reduction in the other.
Road Fatalities Rose 38.7% in 2025 While Serious Injuries Fell 8.4%
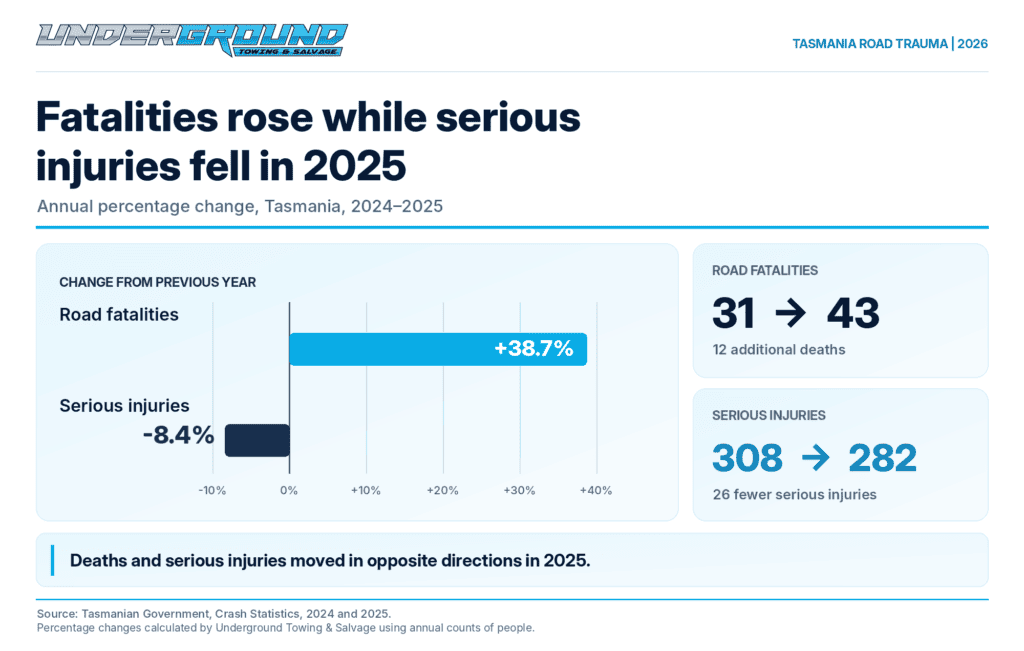
The most significant finding from Underground Towing’s analysis is the divergence between fatalities and serious injuries in 2025.
Fatalities Increased by 12 People
Tasmania recorded 31 road fatalities in 2024 and 43 in 2025.
Underground Towing calculated the year-on-year percentage change:
(43 − 31) ÷ 31 × 100 = 38.7% increase
That represents 12 additional lives lost compared with the previous year.
It also reversed the decline recorded between 2022 and 2024, when annual fatalities fell from 50 to 31.
However, the increase does not establish that Tasmanian roads became 38.7% more dangerous. A change in the number of deaths is not the same as a change in risk per journey or kilometre travelled.
Serious Injuries Decreased by 26 People
Over the same period, Tasmania’s recorded serious injuries decreased from 308 in 2024 to 282 in 2025.
Our calculation:
(282 − 308) ÷ 308 × 100 = 8.4% decrease
This was a reduction of 26 serious injuries.
It was also the second consecutive annual decline in the serious-injury count, following a smaller reduction from 310 in 2023 to 308 in 2024.
What the Opposing Changes Reveal
The contrast is substantial:
- Road fatalities increased by 12 people.
- Serious injuries decreased by 26 people.
- Fatalities rose proportionally while serious injuries declined.
If Tasmania’s 2025 performance were assessed using fatalities alone, the analysis would miss the decline in recorded serious injuries.
Conversely, focusing only on the reduction in serious injuries would overlook the increase in deaths.
Neither measure cancels out the other. Both represent serious human consequences and need to be examined independently.
The annual statistics also do not explain the divergence. Determining whether changes in crash circumstances, road use or other factors contributed would require more detailed evidence than the statewide annual totals used here.
Tasmania's 2025 Road Fatalities Were 22.5% Above the Previous Ten-Year Average
A comparison with the preceding decade provides a different perspective from looking at 2024 alone.
The Tasmanian Government publishes ten-year annual averages covering 2015–2024, providing a historical benchmark for assessing the 2025 results.
Underground Towing compared both 2025 measures with their corresponding government averages.
Road trauma measure | 2015–2024 annual average | 2025 result | Calculated difference |
Road fatalities | 35.1 | 43 | +22.5% |
Serious injuries | 280.2 | 282 | +0.6% |
Source: Tasmanian Government crash statistics. Percentage differences calculated by Underground Towing & Salvage.
Fatalities Remained Substantially Above the Historical Benchmark
Tasmania’s preceding ten-year average was 35.1 road fatalities annually.
With 43 deaths recorded in 2025, our calculation is:
(43 − 35.1) ÷ 35.1 × 100 = 22.5% above average
This shows that the 2025 fatality count was not only higher than the previous year. It also exceeded the average annual toll recorded across 2015–2024.
Although 2025 remained below the 50 fatalities recorded in 2022, it was still substantially above the historical benchmark.
Serious Injuries Were Close to Their Historical Average
The corresponding ten-year average for serious injuries was 280.2 per year.
Tasmania recorded 282 serious injuries in 2025.
(282 − 280.2) ÷ 280.2 × 100 = 0.6% above average
Despite the 8.4% annual decline, the 2025 serious-injury count was almost identical to the preceding decade’s average.
This is a meaningful distinction.
The annual decline indicates improvement relative to 2024, but the longer-term comparison shows that the number of serious injuries remained close to the level recorded across the preceding decade.
The central finding is that Tasmania’s 2025 fatality count was markedly above its historical average, while serious injuries were not.
What Do Three-Year Moving Averages Reveal About Tasmania's Road Trauma?
Individual years can produce sharp changes, particularly when annual fatality counts are relatively small.
To examine the figures beyond single-year movements, Underground Towing calculated consecutive three-year moving averages for fatalities and serious injuries.
Each average combines three years of government data, reducing the influence of any one year’s result.
Fatality Averages Declined Across the Three Periods
Three-year period | Average annual fatalities | Average annual serious injuries |
2021–2023 | 40.0 | 275.7 |
2022–2024 | 38.7 | 295.3 |
2023–2025 | 36.3 | 300.0 |
Source: Tasmanian Government annual crash statistics. Three-year moving averages calculated by Underground Towing & Salvage.
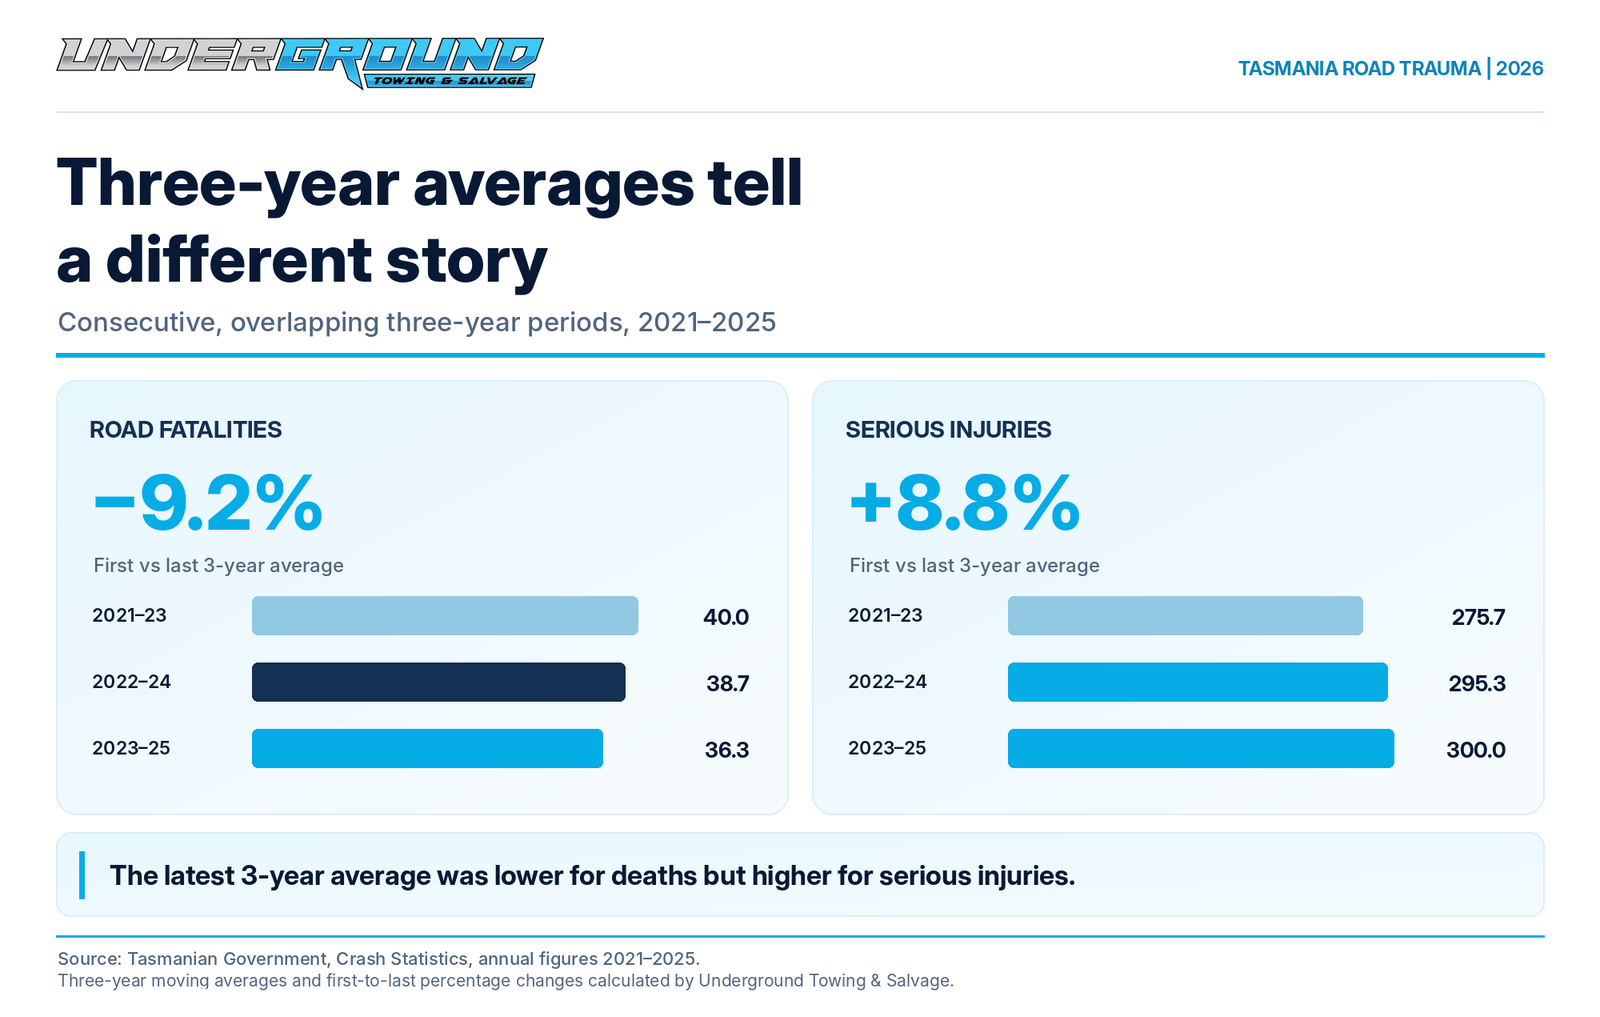
The average annual number of fatalities decreased from 40.0 in the 2021–2023 period to 36.3 in 2023–2025.
That represents a calculated reduction of approximately 9.2% between the first and last three-year averages.
Interestingly, this occurred despite the substantial increase in annual fatalities during 2025.
The reason is that the first period included the unusually high 2022 count of 50 fatalities, whereas the latest period included 35 deaths in 2023, 31 in 2024 and 43 in 2025.
The three-year comparison therefore provides a more balanced view than the latest annual increase alone.
Serious Injury Averages Increased
Serious injuries showed the opposite pattern.
The three-year average increased from 275.7 in 2021–2023 to 300.0 in 2023–2025.
This represents an increase of approximately 8.8% between the first and last periods.
Although recorded serious injuries fell during 2025, the latest three-year average remained higher than the earlier one.
Together, the moving averages reveal a pattern that is less obvious when reviewing annual totals individually:
- The average fatality count was lower in the latest three-year period.
- The average serious-injury count was higher.
- The latest annual movements differed from these broader comparisons.
These are descriptive comparisons, not proof of sustained trends. The three-year periods overlap, and five years of observations are insufficient to establish the underlying causes or statistical significance of the changes.
Nevertheless, they demonstrate why the choice of comparison period can materially affect how Tasmania’s road safety performance is interpreted.
What Do These Findings Mean for Tasmanian Motorists?
Underground Towing’s analysis highlights three important considerations for understanding road safety across Tasmania.
A Lower Serious-Injury Count Does Not Guarantee a Lower Road Toll
The 2025 figures demonstrate that fatalities and serious injuries can move in opposite directions.
Both measures need attention when assessing road trauma. A positive change in one should not obscure a negative change in the other.
One Year’s Figures Do Not Tell the Whole Story
Tasmania recorded 50 fatalities in 2022, 31 in 2024 and 43 in 2025.
These differences show how substantially annual totals can fluctuate.
Comparisons with historical averages and multiple-year periods provide additional context, although they cannot eliminate all uncertainty.
Road Trauma Counts Are Not the Same as Driving Risk
The analysis measures the number of people killed or seriously injured, not the likelihood of a crash occurring during a particular journey.
It does not account for changes in population, traffic volumes, kilometres travelled or the composition of road users.
As a result, the figures cannot establish whether an individual motorist’s risk increased or decreased between 2021 and 2025.
For motorists, the practical priority remains reducing avoidable risks: driving to conditions, maintaining a safe following distance, avoiding distractions and ensuring vehicles are roadworthy before travelling.
These are general road safety precautions, not conclusions about what caused the statistical changes examined in this report.
Research Methodology and Data Sources
This analysis was conducted by Underground Towing & Salvage using publicly available Tasmanian Government road trauma statistics.
Research period: 1 January 2021 to 31 December 2025.
Analysis completed: October 2026.
Primary source: Tasmanian Government – Crash Statistics, last updated 20 July 2026.
How the Calculations Were Produced
Underground Towing independently calculated four measures from the published data.
- Five-year totals and annual averages
The annual fatalities and serious injuries recorded between 2021 and 2025 were added separately.
Each five-year total was divided by five to determine the average annual count.
- Year-on-year percentage changes
The difference between the latest year’s figure and the preceding year’s figure was divided by the preceding year’s figure and multiplied by 100.
For example:
(43 − 31) ÷ 31 × 100 = 38.7%
- Historical benchmark comparisons
The 2025 fatality and serious-injury counts were compared separately with the Tasmanian Government’s published 2015–2024 annual averages.
The difference was expressed as a percentage of the relevant historical average.
- Three-year moving averages
For each measure, three consecutive annual figures were summed and divided by three.
The analysis covered three overlapping periods:
- 2021–2023
- 2022–2024
- 2023–2025
All percentage changes were calculated before rounding. Reported percentages and moving averages are generally presented to one decimal place.
Research Limitations
The following limitations are important when interpreting the findings.
Fatalities and serious injuries are counts of people, not crashes. A single crash may result in multiple casualties.
The calculations do not establish causation. The available annual figures cannot identify whether road conditions, driver behaviour, weather or other factors explain the observed changes.
Historical averages and moving averages serve different purposes. The government’s 2015–2024 benchmark provides longer-term context, while the overlapping three-year averages describe changes within the five-year study period.
The government publishes an unresolved difference in its 2025 combined casualty reporting. Its annual statistical table records 43 fatalities and 282 serious injuries, while its next Road Safety Strategy page, updated 15 October 2026, reports 324 people killed or seriously injured during 2025. The separate annual figures sum to 325. Because that difference has not been reconciled, this analysis reports fatalities and serious injuries separately rather than treating their sum as an official combined casualty total.
Published statistics may be revised. Findings reflect the official figures available when this analysis was completed.
The underlying figures are published by the Tasmanian Government. The derived totals, percentage differences, historical comparisons and moving averages are calculations performed by Underground Towing & Salvage. They should not be interpreted as previously unpublished source data or a new statistical methodology.
Tasmania's Road Trauma Figures Tell Two Different Stories
Tasmania recorded 194 road fatalities and 1,417 serious injuries between 2021 and 2025.
Underground Towing’s analysis reveals that these two measures have not followed the same pattern.
Fatalities increased sharply in 2025 and remained 22.5% above the preceding ten-year average. Serious injuries declined during the same year but remained close to their historical benchmark.
The three-year comparisons provide another perspective, showing a lower average fatality count but a higher average serious-injury count in the latest overlapping period.
The conclusion is clear: Tasmania’s road safety performance cannot be assessed using a single year’s fatality figure. Both deaths and serious injuries matter, and examining multiple periods provides a more complete understanding of the outcomes recorded on the state’s roads.
For additional background, see our Tasmania Road Accident Statistics overview.
Underground Towing & Salvage supports motorists with accident recovery and vehicle transport across Launceston and surrounding areas. If a vehicle cannot be safely driven after a collision or breakdown, our Tasmania towing service can help arrange its transport to a suitable destination.