

Australia does not publish a standalone measure of the towing industry’s size, workload or capacity. Towing services are grouped with the broader road freight industry, making it difficult to isolate towing businesses using conventional industry statistics.
To produce a clearer picture, Underground Towing & Salvage combined vehicle registration, workforce, vehicle age, new sales and roadside-assistance data from authoritative Australian sources.
The resulting analysis examines the number of vehicles supported by each tow truck driver, the age of the towing workforce, the number of older vehicles on the road, the scale of unresolved roadside incidents and how Australia’s changing vehicle mix may affect future recovery requirements.
Underground Towing & Salvage Original Analysis
- Australia has approximately 8,579 registered vehicles for every employed tow truck driver.
- More than half of Australian tow truck drivers are aged 45 or older.
- The proportion of tow truck drivers aged 45+ is 10.7 percentage points higher than the Australian workforce average.
- Almost one-quarter of tow truck drivers are aged 55 or older, while only 5.1% are under 25.
- Published RACV and RACQ figures indicate that approximately 239,150 roadside incidents were not resolved on-site during their latest reporting periods.
- New vehicle sales during 2025 were equivalent to approximately 5.5% of Australia’s registered vehicle fleet.
- SUVs and light-commercial vehicles accounted for 83.3% of new vehicle sales, signalling a continuing shift towards larger vehicles with different recovery requirements.
- Australia’s older-vehicle exposure varies substantially by state, creating different breakdown and recovery conditions across the country.
1. How Many Registered Vehicles Are There per Tow Truck Driver?
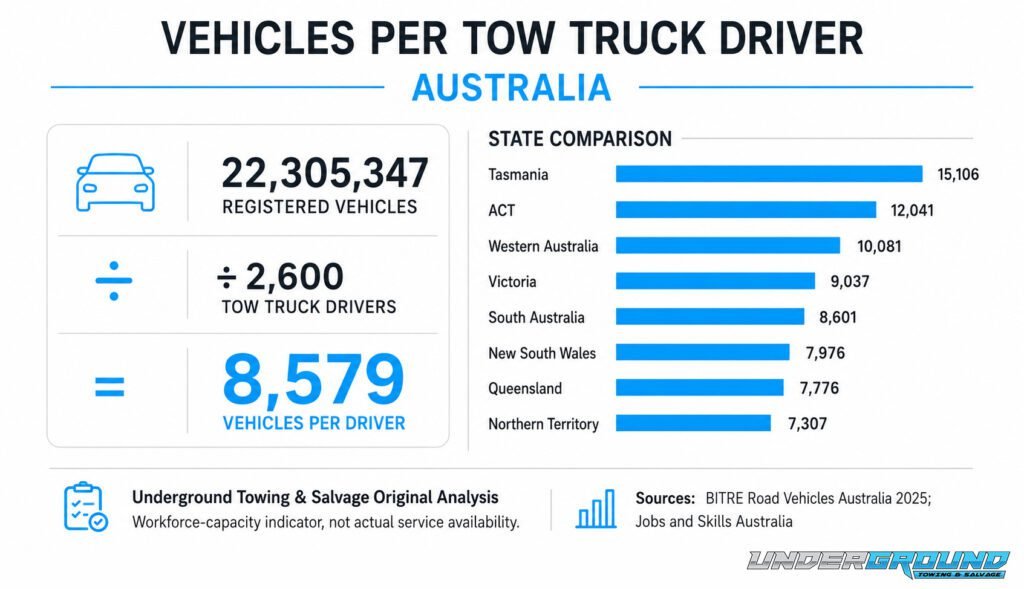
Australia had 22,305,347 registered vehicles as of 31 January 2025. This included passenger vehicles, motorcycles, light commercial vehicles, trucks and buses.
Jobs and Skills Australia estimates that 2,600 people are employed as tow truck drivers nationwide.
Underground Towing & Salvage Original Analysis
Underground Towing & Salvage divided the number of registered vehicles by the estimated number of tow truck drivers:
22,305,347 registered vehicles ÷ 2,600 tow truck drivers = approximately 8,579 vehicles per driver.
The state estimates were calculated by applying each state’s published share of tow truck driver employment to the national total of 2,600 drivers.
State | Registered vehicles | Estimated tow truck drivers | Vehicles per driver |
New South Wales | 6,407,874 | 803 | 7,976 |
Victoria | 5,686,171 | 629 | 9,037 |
Queensland | 4,892,464 | 629 | 7,776 |
South Australia | 1,632,496 | 190 | 8,601 |
Western Australia | 2,621,126 | 260 | 10,081 |
Tasmania | 549,847 | 36 | 15,106 |
Northern Territory | 170,989 | 23 | 7,307 |
Australian Capital Territory | 344,380 | 29 | 12,041 |
Australia | 22,305,347 | 2,600 | 8,579 |
Tasmania recorded the highest estimated ratio, with approximately 15,106 registered vehicles per tow truck driver. The ACT followed with approximately 12,041 vehicles per driver.
The Northern Territory recorded the lowest ratio at approximately 7,307 vehicles per driver, followed by Queensland at 7,776. A lower ratio, however, does not necessarily mean drivers have better access to towing services. Large service areas and long travel distances can reduce practical coverage.
These figures should be treated as a workforce-capacity indicator, not a measure of the number of tow trucks currently available. The employment data does not show how many drivers operate at any given time, whether they work full-time or what vehicles and recovery equipment they can access.
“Driver numbers only show part of the picture. A towing operator may cover a large area, work limited hours or operate equipment suited to only certain types of vehicles. The distance to the incident, the vehicle’s condition and whether specialised equipment is required all affect how much towing capacity is actually available.”
Joshua Harrison, Owner of Underground Towing & Salvage
2. How Many Older Vehicles Are There per Tow Truck Driver?
Vehicle age is another important indicator of potential towing and recovery demand.
To examine Australia’s older-vehicle exposure, Underground Towing & Salvage grouped the registered fleet by year of manufacture:
- 2014 or earlier: 10,998,039 vehicles
- 2015–2019: 5,691,940 vehicles
- 2020–2025: 5,605,425 vehicles
- Year not stated: 9,943 vehicles
Vehicles manufactured in 2014 or earlier were classified as aged 10 years or more. This conservative cut-off ensures every vehicle included had reached at least 10 years of age by January 2025.
Underground Towing & Salvage Original Analysis
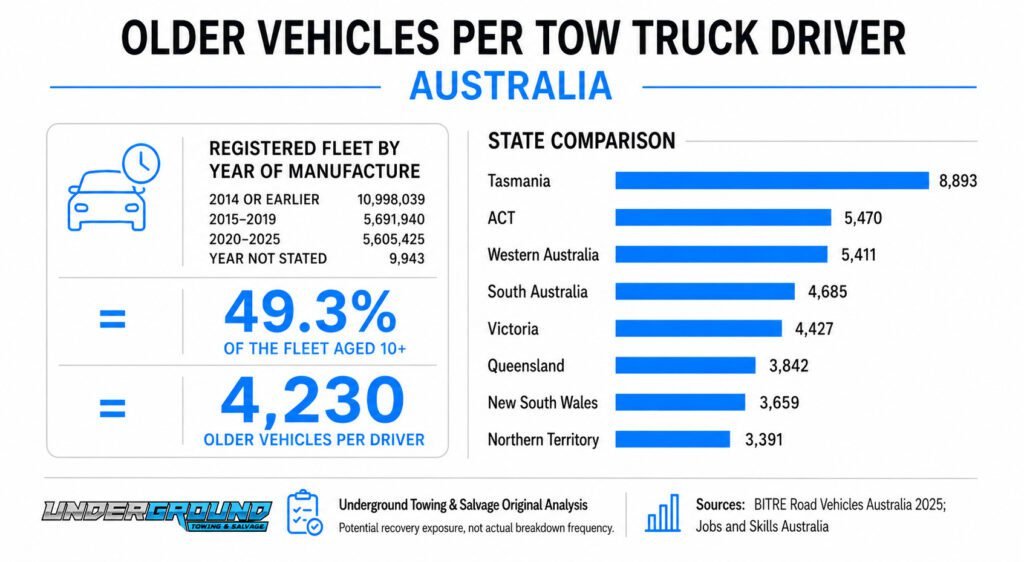
Of Australia’s 22.3 million registered vehicles, 10,998,039 were manufactured in 2014 or earlier. This means 49.3% of the national fleet was at least 10 years old.
Dividing these vehicles by Australia’s estimated 2,600 tow truck drivers produces approximately 4,230 older vehicles per driver.
The state calculations combine BITRE’s vehicle age records with the state distribution of tow truck drivers published by Jobs and Skills Australia.
State | Vehicles aged 10+ | Share of fleet aged 10+ | Older vehicles per tow truck driver |
New South Wales | 2,939,432 | 45.9% | 3,659 |
Victoria | 2,785,539 | 49.0% | 4,427 |
Queensland | 2,417,573 | 49.4% | 3,842 |
South Australia | 889,256 | 54.5% | 4,685 |
Western Australia | 1,406,757 | 53.7% | 5,411 |
Tasmania | 323,713 | 58.9% | 8,893 |
Northern Territory | 79,341 | 46.4% | 3,391 |
Australian Capital Territory | 156,428 | 45.4% | 5,470 |
Australia | 10,998,039 | 49.3% | 4,230 |
Tasmania had the highest older-vehicle share, with 58.9% of its registered fleet manufactured in 2014 or earlier. It also recorded the highest ratio, at approximately 8,893 older vehicles per tow truck driver.
The ACT had the lowest older-vehicle share at 45.4%, which was 13.5 percentage points below Tasmania. However, because the ACT also has a relatively small estimated towing workforce, it still recorded approximately 5,470 older vehicles per driver.
Registered Vehicles Aged 10+ per Tow Truck Driver, by State
Estimated state comparison based on vehicles manufactured in 2014 or earlier.
State | Vehicles |
Tasmania | 8893 |
Australian Capital Territory | 5470 |
Western Australia | 5411 |
South Australia | 4685 |
Victoria | 4427 |
Queensland | 3842 |
New South Wales | 3659 |
Northern Territory | 3391 |
These figures indicate potential breakdown and recovery exposure, not actual breakdown frequency.
Vehicle age alone does not determine reliability. Maintenance history, kilometres travelled, vehicle condition, road environment and usage all influence whether a vehicle is likely to require assistance.
3. Is Australia’s Tow Truck Workforce Getting Older?
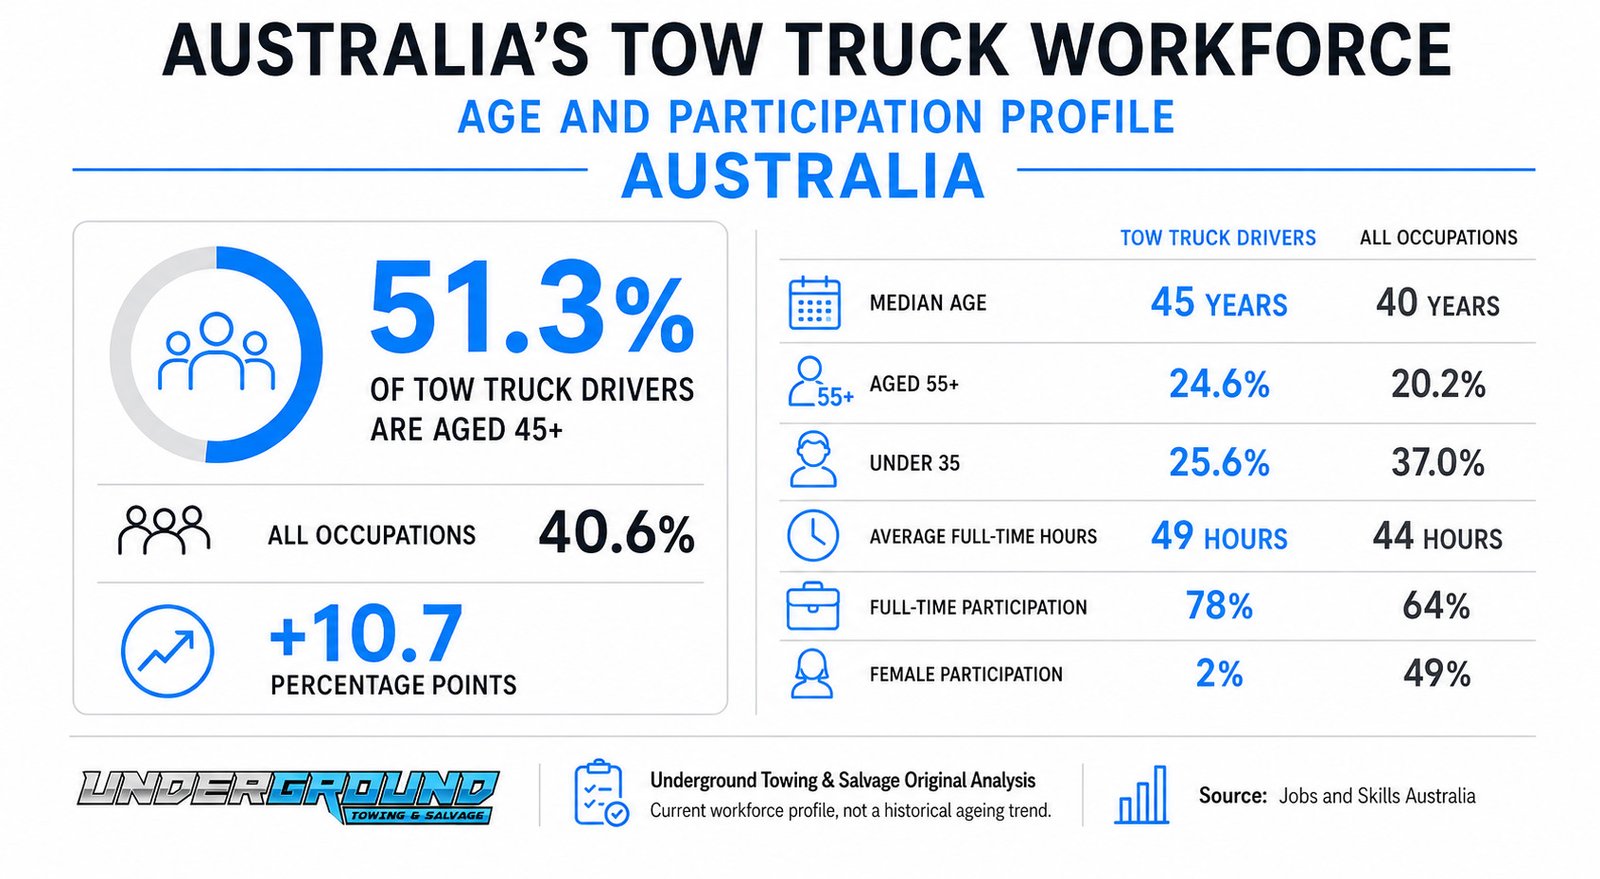
Australian tow truck drivers have a noticeably older workforce profile than Australian workers overall.
The median tow truck driver is 45 years old, compared with 40 years across all occupations. Tow truck drivers also work an average of 49 full-time hours per week, five hours more than the workforce-wide average.
Underground Towing & Salvage Original Analysis
More than half of Australian tow truck drivers are aged 45 or older. At 51.3%, this is 10.7 percentage points above the 40.6% recorded across all occupations.
Underground Towing & Salvage calculated these figures by combining the individual age bands published by Jobs and Skills Australia.
Workforce measure | Tow truck drivers | All occupations | Difference |
Median age | 45 years | 40 years | +5 years |
Aged 45+ | 51.3% | 40.6% | +10.7 percentage points |
Aged 55+ | 24.6% | 20.2% | +4.4 percentage points |
Under 35 | 25.6% | 37.0% | -11.4 percentage points |
Average full-time hours | 49 hours | 44 hours | +5 hours |
Full-time participation | 78% | 64% | +14 percentage points |
Female participation | 2% | 49% | -47 percentage points |
The difference is especially clear at the younger end of the workforce. Only 25.6% of tow truck drivers are under 35, compared with 37% of workers across all occupations.
At the same time, almost one-quarter of tow truck drivers are aged 55 or older. This creates a potential longer-term replacement challenge as experienced drivers approach retirement and fewer younger workers enter the occupation.
The workforce is also highly male-dominated. Women represent just 2% of tow truck drivers, compared with 49% of workers nationally. Broader recruitment could therefore provide one opportunity to expand the industry’s future labour pool.
These figures do not prove that Australia’s towing workforce is becoming older over time because they do not provide a consistent historical trend. They show that the current workforce profile is older than the national workforce and may face increased replacement pressure in the years ahead.
4. How Many Roadside Incidents Could Not Be Resolved On-Site?
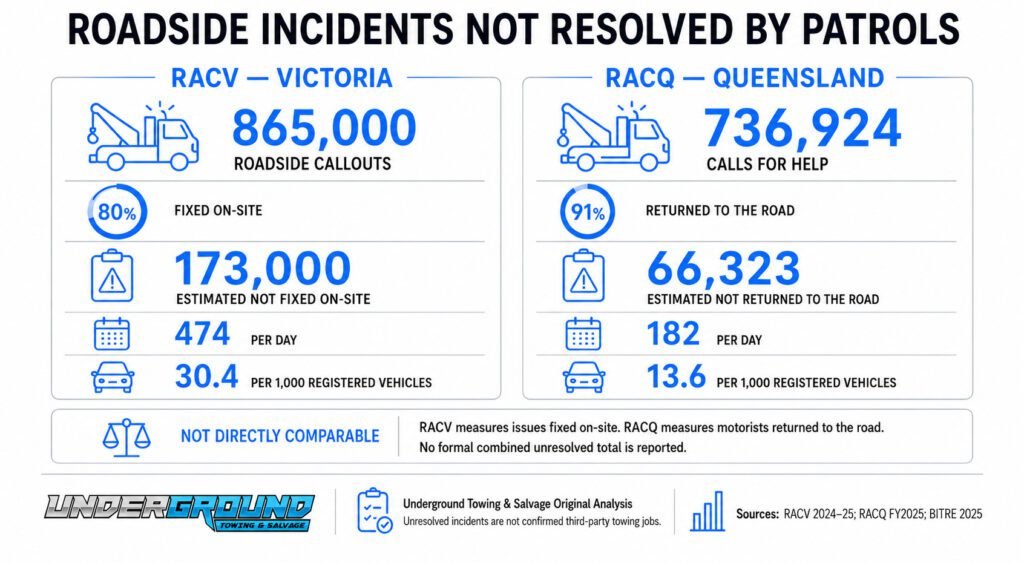
Roadside assistance providers resolve most incidents without requiring further vehicle recovery. However, their published figures indicate that tens of thousands of vehicles still require additional assistance each year.
RACV responded to more than 865,000 emergency roadside assistance callouts in Victoria during 2024–25. RACV states that eight out of ten issues are fixed on the spot.
RACQ responded to 736,924 calls for help during FY2025 and reported that its patrols helped 91% of motorists get back on the road.
Underground Towing & Salvage Original Analysis
Based on RACV’s 80% on-site repair rate, approximately 173,000 Victorian callouts were not fixed at the scene.
Applying RACQ’s 91% return-to-road rate indicates that approximately 66,323 Queensland callouts were not returned to the road by attending patrols.
Organisation | Roadside incidents | Resolved by patrol | Estimated unresolved incidents |
RACV | 865,000 | 80% | 173,000 |
RACQ | 736,924 | 91% | 66,323 |
Combined | 1,601,924 | Not directly comparable | Not reported as a formal total |
The estimated RACV figure represents approximately 474 unresolved incidents per day, while the RACQ figure represents approximately 182 per day.
When compared with each state’s registered vehicle fleet, the estimates equal:
- 30.4 unresolved RACV incidents per 1,000 registered Victorian vehicles
- 13.6 unresolved RACQ incidents per 1,000 registered Queensland vehicles
Registered vehicle totals were taken from BITRE’s January 2025 vehicle data.
A formal combined estimate has not been reported because the two organisations use different measures. RACV reports the proportion of issues fixed on the spot, while RACQ reports the proportion of motorists helped back onto the road. These outcomes may not be defined or recorded in exactly the same way.
Important Clarification
An unresolved roadside incident is not automatically a commercial towing job. Some vehicles may have been transported by the organisation’s own towing network, referred to a contractor or handled through another recovery arrangement.
These figures therefore indicate the potential scale of incidents requiring further assistance. They do not measure the number of towing jobs completed by Australia’s commercial towing industry.
The earlier Key Findings box should also be corrected by replacing the combined 239,150 figure with:
RACV figures indicate approximately 173,000 Victorian callouts were not fixed on-site, while RACQ figures indicate approximately 66,323 Queensland motorists were not returned to the road by attending patrols.
5. How Quickly Is Australia Replacing Its Vehicle Fleet?
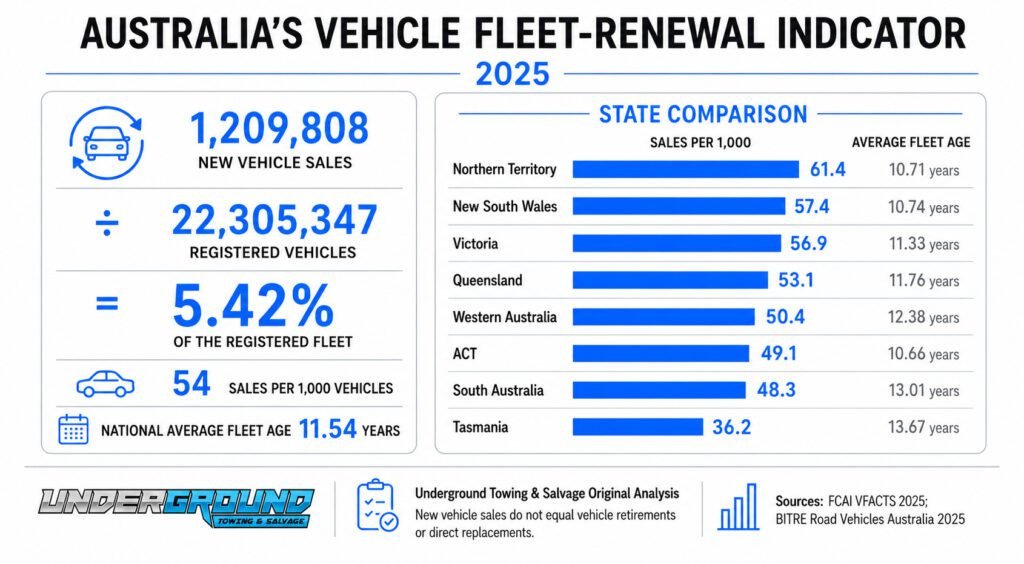
Australia recorded 1,209,808 new vehicle sales through VFACTS during 2025. New South Wales recorded the largest number, followed by Victoria and Queensland.
For comparison, Australia had 22,305,347 registered motor vehicles as of 31 January 2025. The national fleet had an average age of 11.54 years.
Underground Towing & Salvage Original Analysis
New vehicle sales during 2025 were equivalent to approximately 5.42% of Australia’s registered vehicle fleet.
This represents approximately 54 new vehicle sales for every 1,000 vehicles already registered.
The national indicator was calculated as follows:
1,209,808 ÷ 22,305,347 × 100 = 5.42%
The same calculation was completed for every state and territory.
State | Registered fleet | New vehicle sales | Sales per 1,000 vehicles | Average fleet age |
New South Wales | 6,407,874 | 367,947 | 57.4 | 10.74 years |
Victoria | 5,686,171 | 323,768 | 56.9 | 11.33 years |
Queensland | 4,892,464 | 259,903 | 53.1 | 11.76 years |
South Australia | 1,632,496 | 78,811 | 48.3 | 13.01 years |
Western Australia | 2,621,126 | 132,067 | 50.4 | 12.38 years |
Tasmania | 549,847 | 19,892 | 36.2 | 13.67 years |
Northern Territory | 170,989 | 10,503 | 61.4 | 10.71 years |
Australian Capital Territory | 344,380 | 16,917 | 49.1 | 10.66 years |
Australia | 22,305,347 | 1,209,808 | 54.2 | 11.54 years |
The Northern Territory recorded the highest relative sales rate, with 61.4 new vehicles sold per 1,000 registered vehicles. Its fleet was also among the youngest, averaging 10.71 years.
Tasmania recorded the lowest rate at 36.2 sales per 1,000 registered vehicles and had the oldest fleet, with an average age of 13.67 years. Its sales rate was approximately one-third below the national average.
South Australia and Western Australia also recorded below-average sales rates alongside older-than-average fleets. However, the pattern was not universal. The ACT had Australia’s youngest fleet despite recording only 49.1 sales per 1,000 registered vehicles during 2025.
These figures provide a fleet-renewal indicator, not a direct vehicle replacement rate. A new vehicle sale does not necessarily remove an older vehicle from the road. It may replace another recently manufactured vehicle, enter a business fleet or increase the total number of registered vehicles.
Registrations can therefore continue growing at the same time that millions of older vehicles remain in use. This helps explain why strong annual new vehicle sales do not automatically produce a young national fleet or remove the need for breakdown and recovery services.
6. SUVs, Commercial Vehicles and EVs Are Changing Recovery Requirements
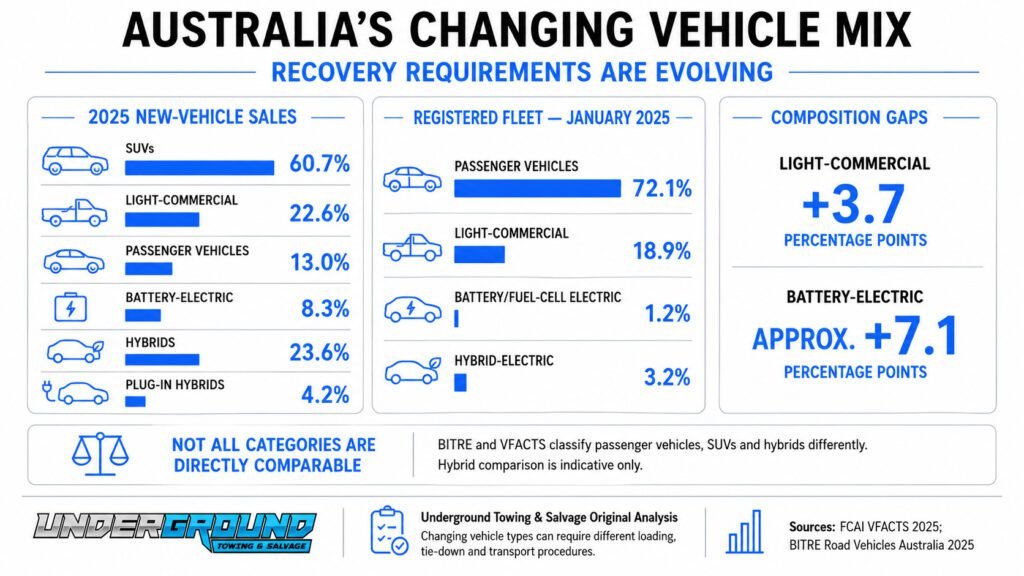
Australia’s new-vehicle market is shifting towards SUVs, light-commercial vehicles and electrified powertrains.
In 2025, SUVs accounted for 60.7% of new vehicle sales, followed by light-commercial vehicles at 22.6%. Traditional passenger vehicles represented only 13%, with sales falling 22.6% year on year to 157,484.
Electrified vehicles also represented a growing share of the market. Battery-electric vehicles accounted for 8.3% of sales, hybrids for 23.6% and plug-in hybrids for a further 4.2%.
BITRE’s registration data shows a different existing fleet. As of January 2025:
- Passenger vehicles represented 72.1% of registered vehicles.
- Light-commercial vehicles represented 18.9%.
- Battery and fuel-cell electric vehicles represented approximately 1.2%.
- Hybrid-electric vehicles represented approximately 3.2%.
Underground Towing & Salvage Original Analysis
Light-commercial vehicles represented 22.6% of new sales but only 18.9% of the existing fleet—a 3.7 percentage-point composition gap.
Battery-electric vehicles represented 8.3% of new sales but approximately 1.2% of registered vehicles—a gap of around 7.1 percentage points.
This indicates that commercial and electric vehicles are entering the market at a greater rate than their current presence in the registered fleet.
Vehicle category | Share of registered fleet | Share of new sales | Composition gap |
Passenger vehicles | 72.1% | 13.0% | Not directly comparable |
SUVs | Not separately reported | 60.7% | Not available |
Light-commercial vehicles | 18.9% | 22.6% | +3.7 percentage points |
Battery-electric vehicles | 1.2%* | 8.3% | Approximately +7.1 percentage points |
Hybrids | 3.2% | 23.6% | Indicatively +20.4 percentage points |
*BITRE combines battery-electric and fuel-cell electric vehicles. Fuel-cell vehicles represent only a small part of that category.
The passenger-vehicle and SUV categories cannot be compared directly. BITRE classifies registrations according to vehicle construction and use, while VFACTS separates passenger cars and SUVs as sales segments. Many vehicles sold as SUVs are included within BITRE’s broader passenger-vehicle category.
The hybrid comparison should also be treated as indicative. BITRE’s registration category and FCAI’s separate hybrid and plug-in hybrid sales categories do not use an identical breakdown.
The clearest like-for-like comparison is light-commercial vehicles. Their share of new sales was 3.7 percentage points above their share of the registered fleet, suggesting that utes, vans and other commercial vehicles are becoming a larger part of Australia’s recovery environment.
“Vehicle type matters when planning a recovery. Larger SUVs, dual-cab utes and commercial vehicles can be heavier and may require different loading angles, tie-down points or truck capacity. Electric vehicles also need to be transported in line with the manufacturer’s requirements, particularly if the battery or wheels have been damaged.
“Low-clearance vehicles create another challenge because the recovery truck, approach angle and available space all need to be considered. The right equipment has to be selected before the vehicle is moved—not after the operator arrives.”
Joshua Harrison, Owner of Underground Towing & Salvage
What Is Driving Towing Demand in Australia?
Towing demand is not created by one factor. It reflects the number and condition of vehicles on the road, how far they travel and the incidents that leave them unsafe or unable to continue.
Australia’s registered fleet grew across every state and territory between January 2024 and January 2025. Western Australia and Victoria recorded the strongest growth, at 3.65% and 3.05% respectively.
Older vehicles also remain a substantial part of the fleet. As the earlier analysis shows, almost half were manufactured in 2014 or earlier. Age alone does not cause a breakdown, but batteries, cooling systems, electrical components and driveline parts can become more vulnerable over time.
Road crashes create a separate need for accident recovery. Australia recorded 1,300 road deaths in 2024, while the latest nationally available data recorded 35,815 hospitalised road injuries in 2022. These figures do not measure towing jobs, but they demonstrate the continuing scale of serious road trauma.
Freight activity increases exposure among work utes, delivery vans, trucks and other commercial vehicles. Australia’s domestic freight task is projected to increase from 756 billion tonne-kilometres in 2020 to 964 billion by 2050. (https://www.infrastructure.gov.au/infrastructure-transport-vehicles/transport-strategy-policy/freight-supply-chains/national-freight-data-hub/national-freight-and-supply-chain-strategy)
Caravan and regional travel create additional seasonal demand. Australians took approximately 15.2 million caravan and camping trips in 2024, generating 57.1 million visitor nights. Long-distance travel can leave motorists further from repair facilities when a vehicle or trailer fails.
The financial consequences of a collision are also increasing. Average Australian motor insurance claim costs rose by 42% between 2019 and 2024, reflecting higher repair costs and increasingly complex vehicle technology. Correct recovery procedures are therefore important for preventing further damage after an incident.
What the Data Means for Australian Drivers and Businesses
Australia has approximately 8,579 registered vehicles for every employed tow truck driver, including around 4,230 vehicles manufactured in 2014 or earlier.
The workforce itself may face future capacity pressure. More than half of tow truck drivers are aged 45 or older, while only one-quarter are under 35.
Recovery work is also becoming more specialised. SUVs, commercial vehicles, hybrids and battery-electric vehicles make up a growing share of new sales. These vehicles can require different loading techniques, tie-down points, equipment capacities and transport procedures.
Driver numbers alone therefore do not determine towing availability. Practical capacity also depends on:
- Distance from the incident
- Operating hours and response coverage
- Vehicle size, weight and condition
- Access restrictions
- Suitable trucks and recovery equipment
- Operator training and experience
For drivers and businesses, the priority is not simply finding an available tow truck. It is finding an operator with the right equipment and experience to recover the vehicle safely without causing further damage.
Methodology
This report uses data from:
- BITRE Road Vehicles Australia, January 2025
- Jobs and Skills Australia’s Tow Truck Drivers occupation profile
- FCAI 2025 new vehicle sales data
- RACV 2024–25 roadside assistance reporting
- RACQ FY2025 roadside assistance reporting
The most recent available reference period was used for each dataset. As the reporting periods differ, comparisons should be treated as indicators rather than measurements from a single date.
Calculations used in this report include:
- Vehicles per driver: registered vehicles divided by employed tow truck drivers
- State driver estimates: 2,600 national drivers multiplied by each state’s published employment share
- Older vehicles per driver: vehicles manufactured in 2014 or earlier divided by estimated tow truck drivers
- Fleet-renewal indicator: 2025 new vehicle sales divided by January 2025 registrations
- Composition gap: share of new sales minus share of the registered fleet
- Unresolved roadside incidents: total roadside incidents multiplied by the proportion not fixed on-site or returned to the road
Vehicles manufactured in 2014 or earlier were classified as aged 10 years or more. This conservative threshold ensures every vehicle counted had reached at least 10 years of age by January 2025.
RACV unresolved incidents refer to callouts not fixed on the spot. RACQ unresolved incidents refer to motorists not returned to the road by attending patrols. These measures were calculated and reported separately because their definitions are not identical.
Estimated driver numbers were calculated using unrounded state employment shares. Final driver totals and vehicle ratios were rounded to the nearest whole number. Percentages were generally rounded to one decimal place.
All derived figures were calculated by Underground Towing & Salvage from the cited primary datasets.
Limitations
This analysis combines datasets with different definitions and reporting periods. The following limitations should be considered when interpreting the findings:
- Tow truck driver figures are based substantially on 2021 Census data.
- Employment figures do not represent the number of licensed operators or available tow trucks.
- Vehicle-to-driver ratios are capacity indicators, not measures of actual service availability.
- Older-vehicle figures indicate potential breakdown exposure, not breakdown probability.
- Unresolved roadside incidents are not confirmed third-party towing jobs.
- New vehicle sales do not equal vehicle retirements or direct replacements.
- ANZSIC road-freight data includes towing alongside other transport services and cannot isolate the towing industry.
Data Sources
This report uses publicly available data from Australian government agencies, motoring organisations and industry bodies. Underground Towing & Salvage used the following sources for its calculations and analysis:
- BITRE Road Vehicles Australia, January 2025
- BITRE Registered Vehicles by Type, State and Year of Manufacture
- Jobs and Skills Australia – Tow Truck Drivers
- FCAI – Australia’s New Vehicle Market in 2025
- FCAI – Review of the Electric Car Discount
- RACV Annual Report 2024–25
- RACV Emergency Roadside Assistance
- RACQ FY2025 Roadside Assistance Data
- BITRE Road Trauma Australia – Annual Summaries
- Australian Government Review of the National Freight and Supply Chain Strategy
- Caravan Industry Association of Australia – Industry Data
- Insurance Council of Australia – Industry Snapshot 2025
About Underground Towing & Salvage
Underground Towing & Salvage provides professional towing and vehicle recovery services across Canberra, Queanbeyan and Tasmania.
Led by Joshua Harrison, the team handles accident recovery, roadside breakdowns, interstate vehicle transport and complex towing jobs. Its specialised low-clearance truck can access underground car parks and confined areas that standard tow trucks may be unable to enter.